Visualization Library: ProDiver
Stamps

DivePort

ProDiver
DiveTab
Dashboards
ProDiver (52): Charts + Indicators
Areas (2)

ProDiver
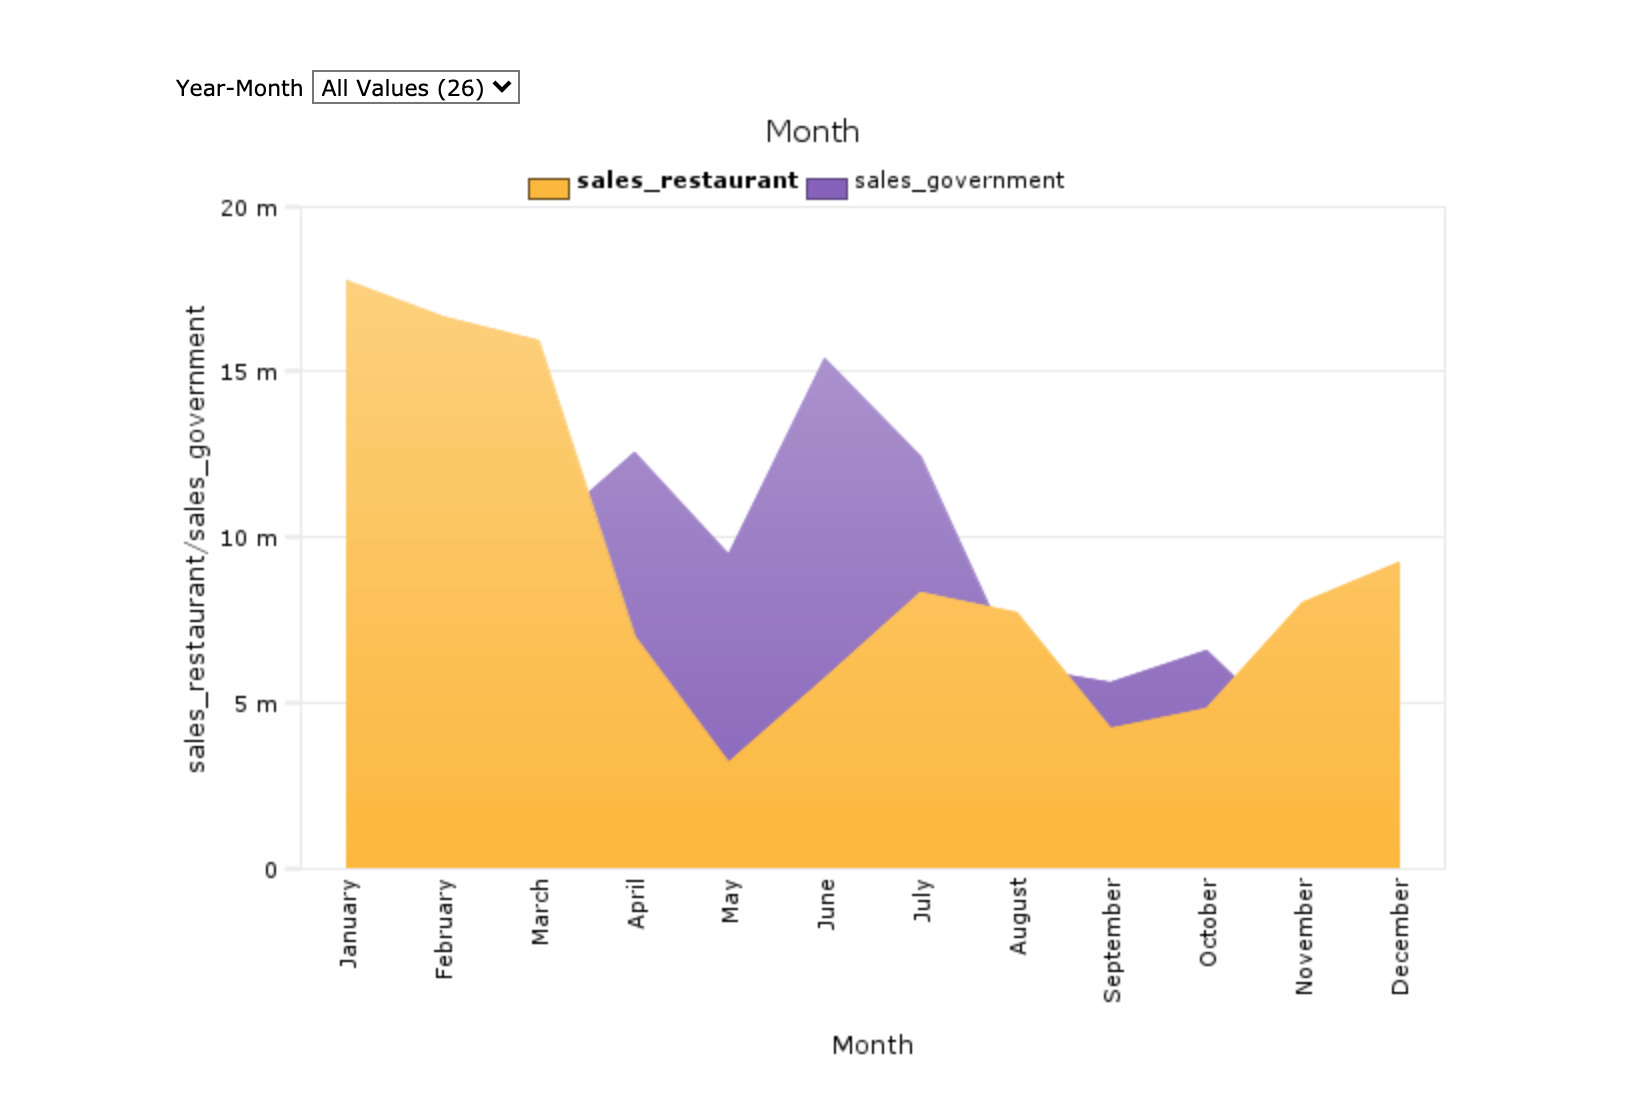
Area Plot Graph
Basic plot graphs display data for a single dimension and up to 16 summaries. They consist of a series of plotted points that correspond to summary values being displayed.
Area Spline Plot Graph
Basic plot graphs display data for a single dimension and up to 16 summaries. They consist of a series of plotted points that correspond to summary values being displayed.
Bars (12)


ProDiver
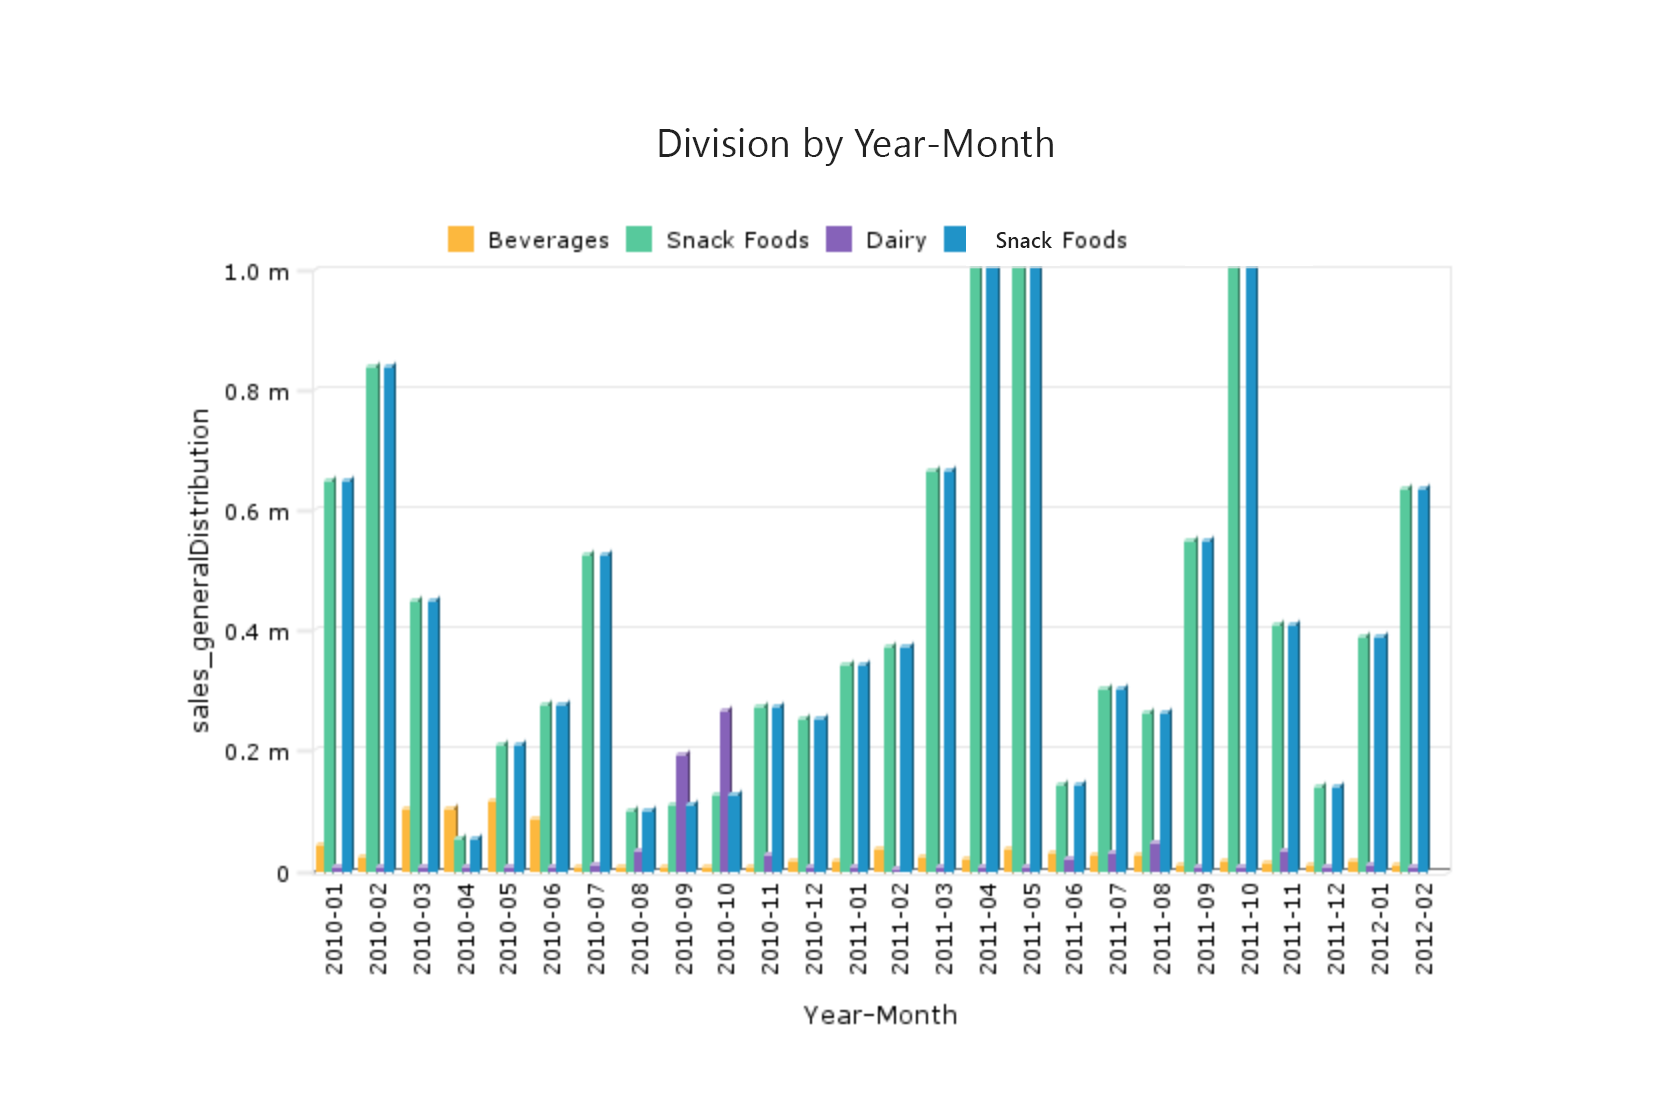
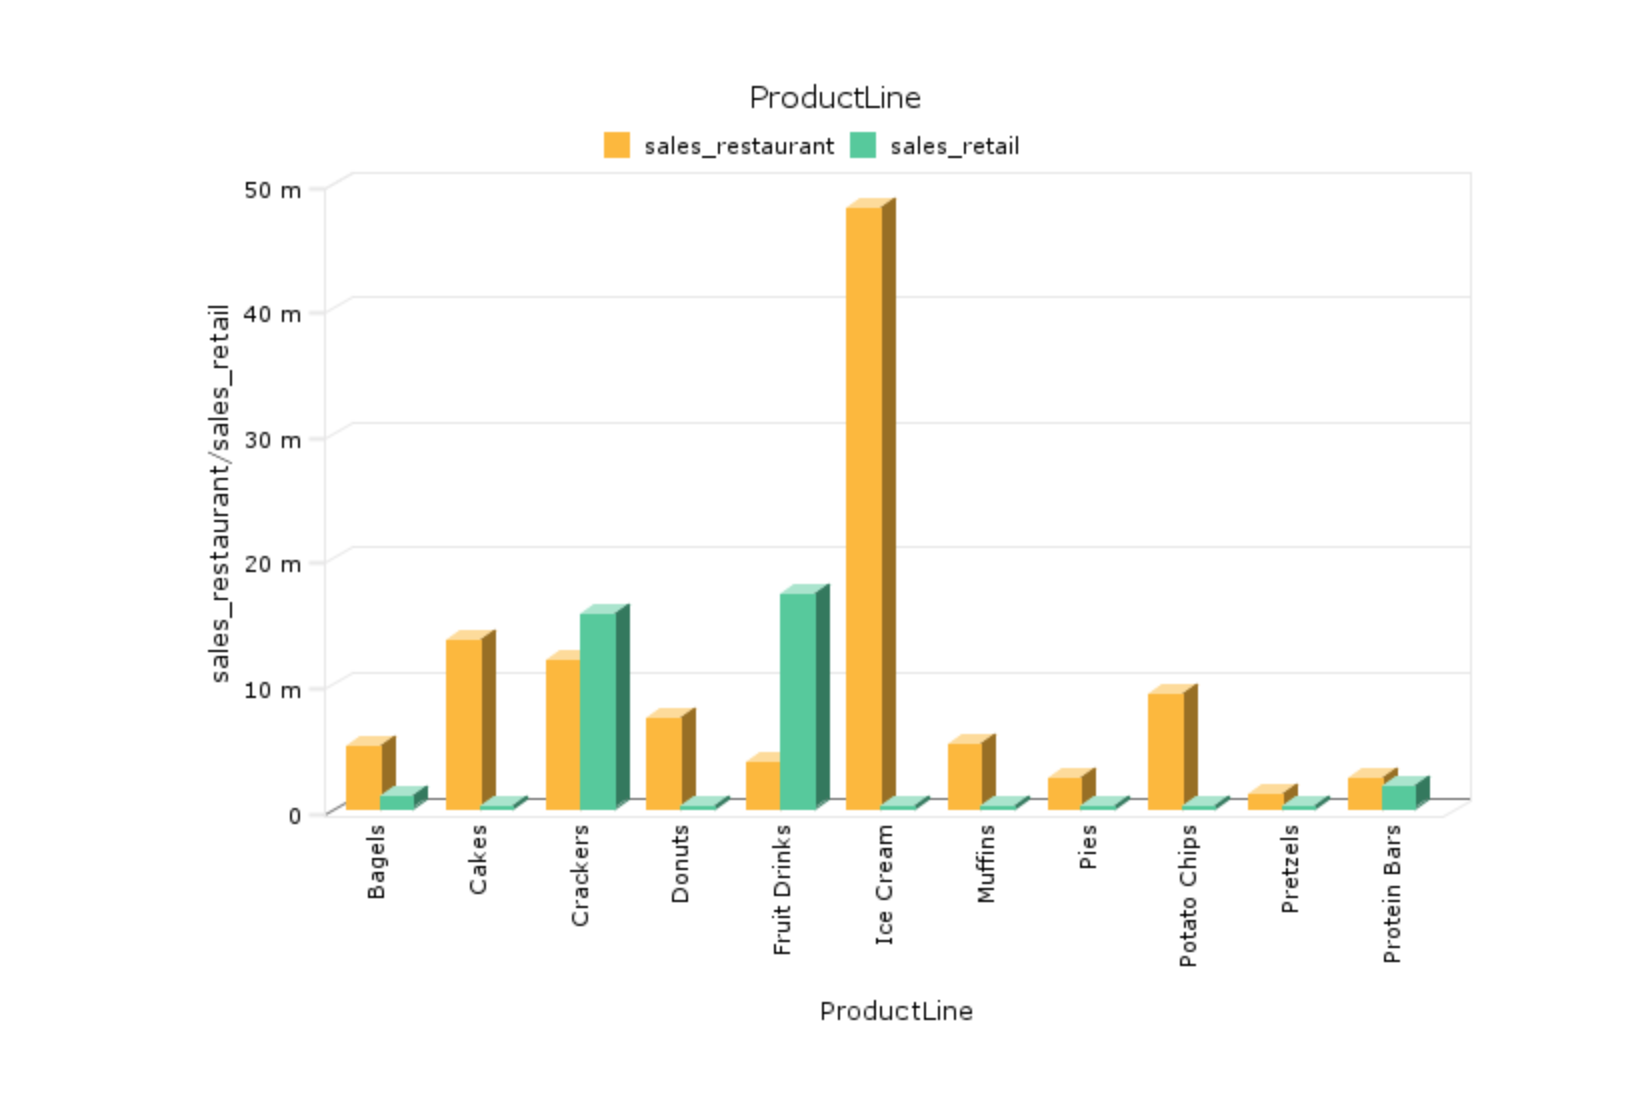
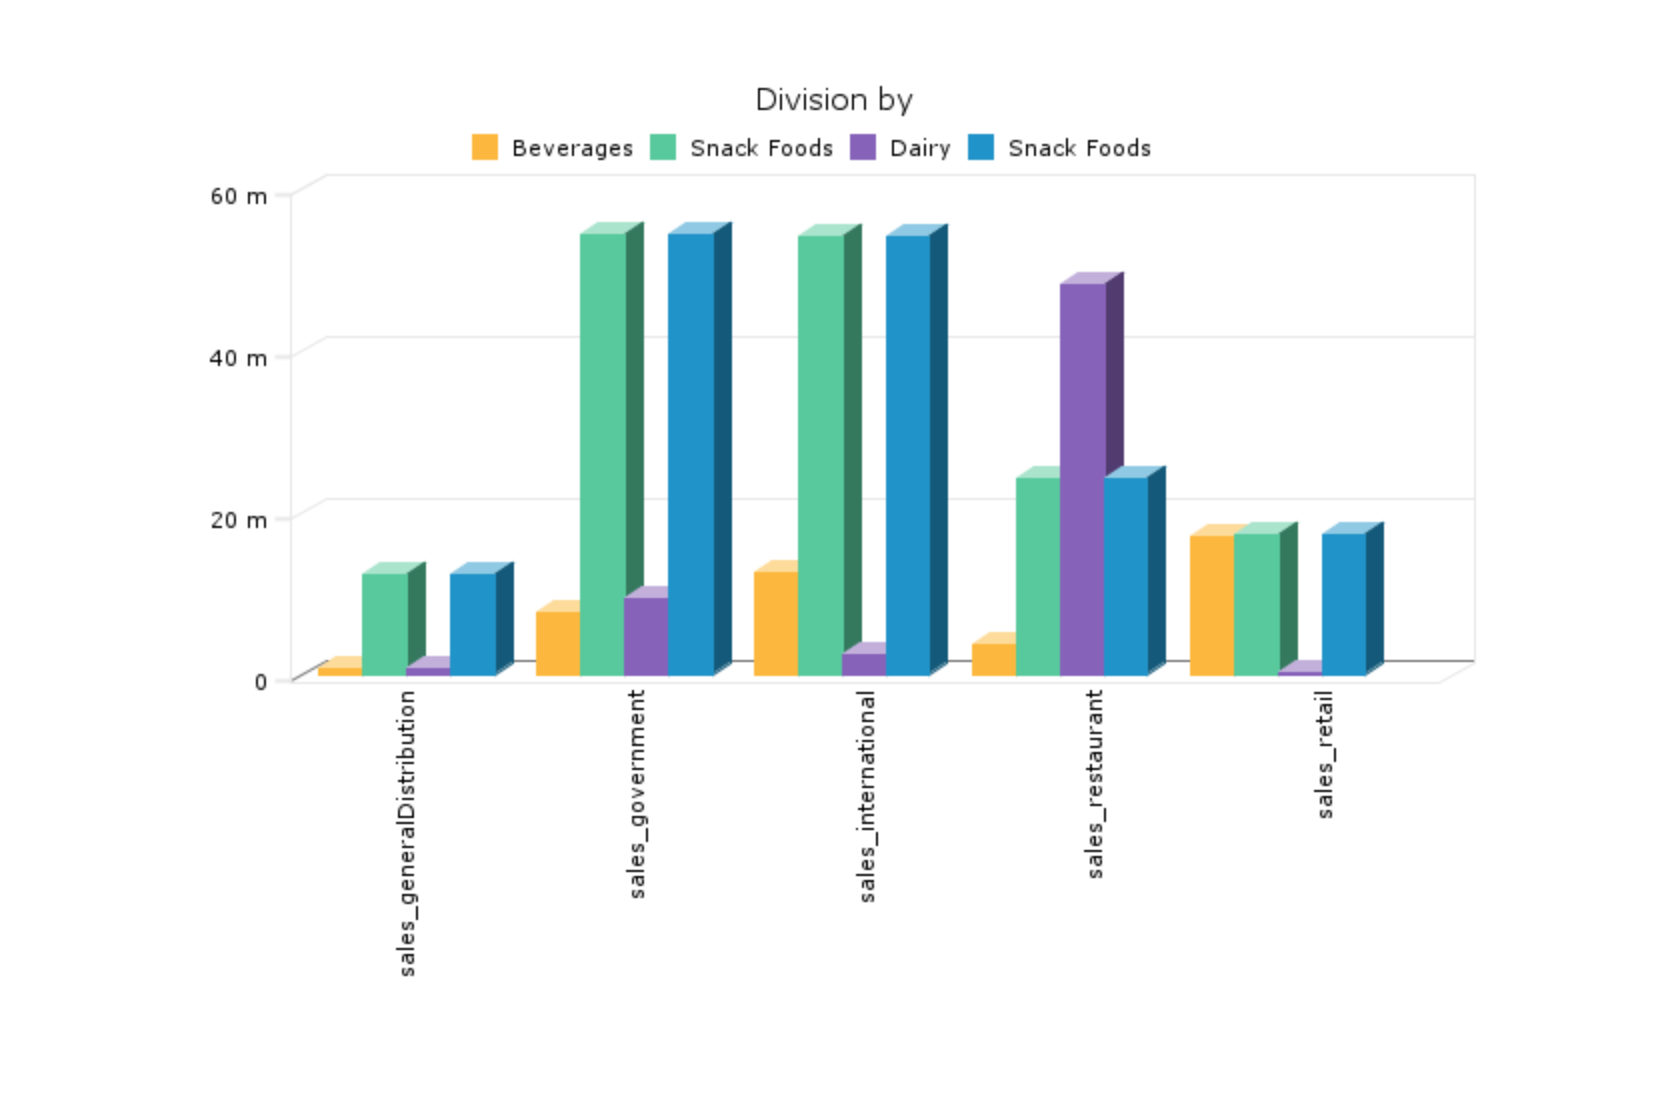
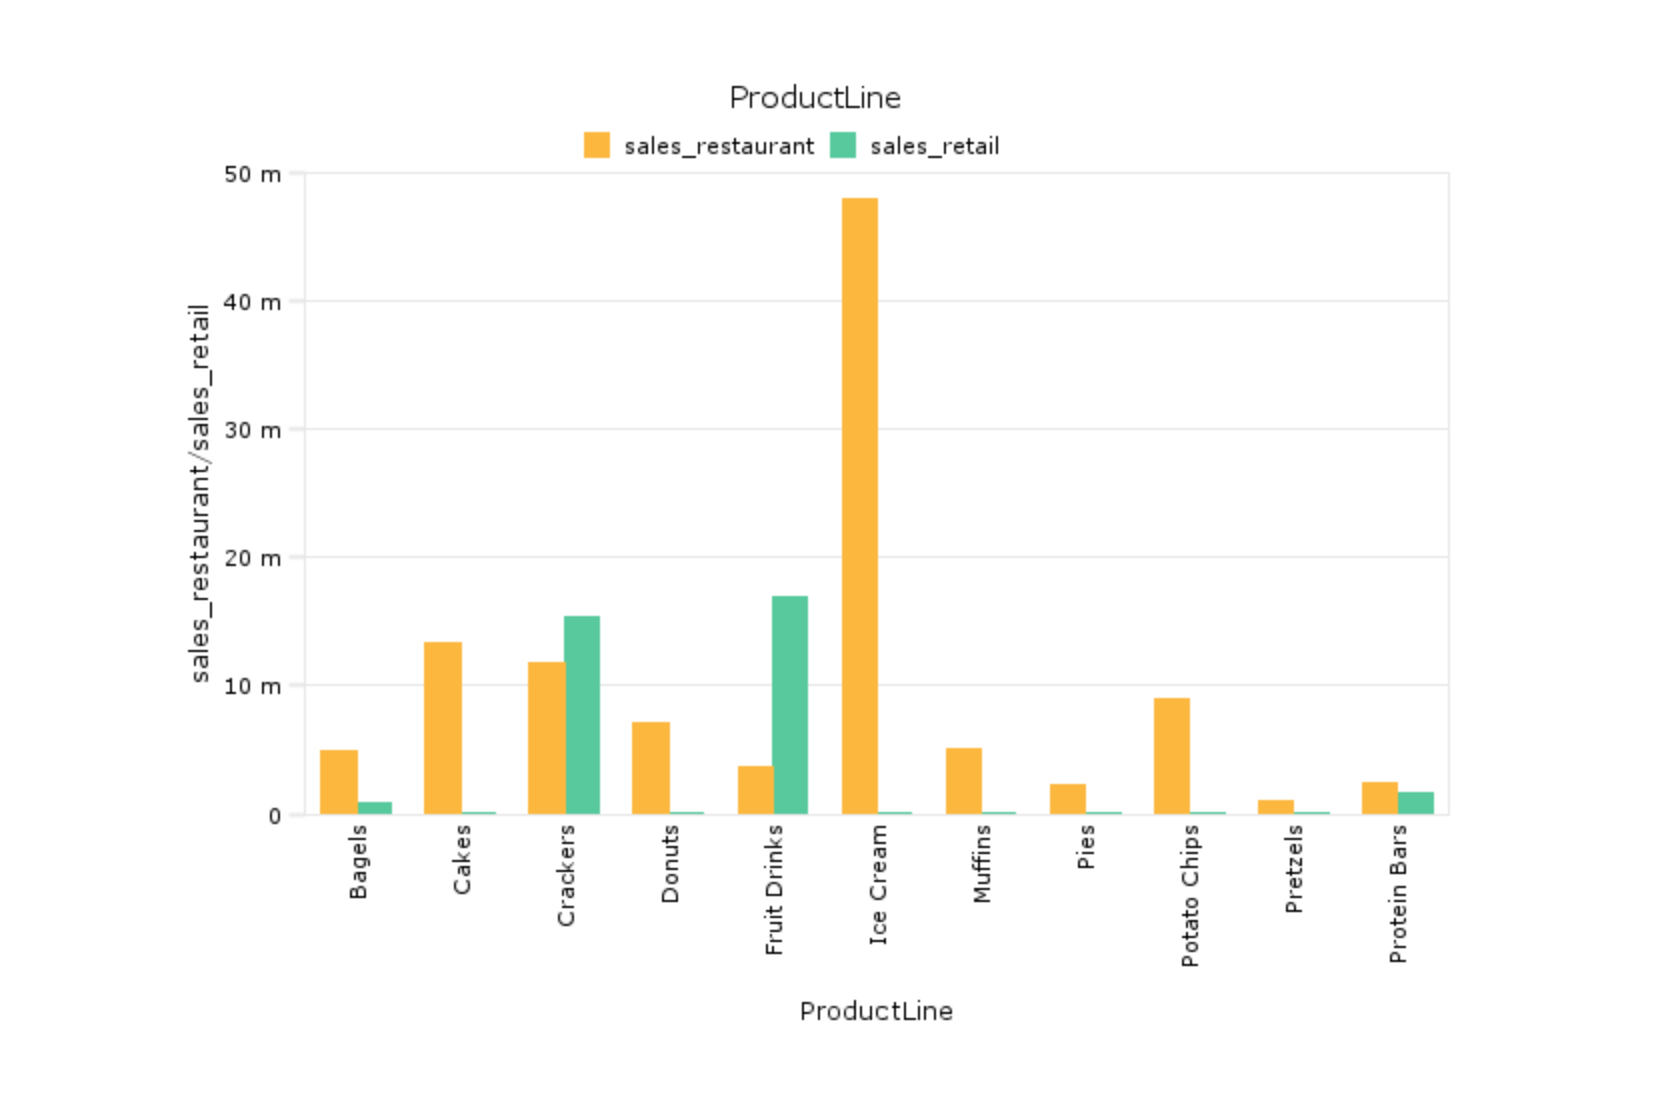
Bar Plot Graph
A bar plot graph displays data as horizontal bars.
3-D Bar Plot Graph
A bar plot graph displays data as horizontal 3-D bars.
Bar Cross Plot
Cross plot graphs shows data that pertains to two dimensions simultaneously.
Bar Summary Cross Plot
Cross plot graphs shows data that pertains to two dimensions simultaneously.
3-D Bar Cross Plot
Cross plot graphs shows data that pertains to two dimensions simultaneously.
3-D Bar Summary Cross Plot
Cross plot graphs shows data that pertains to two dimensions simultaneously.
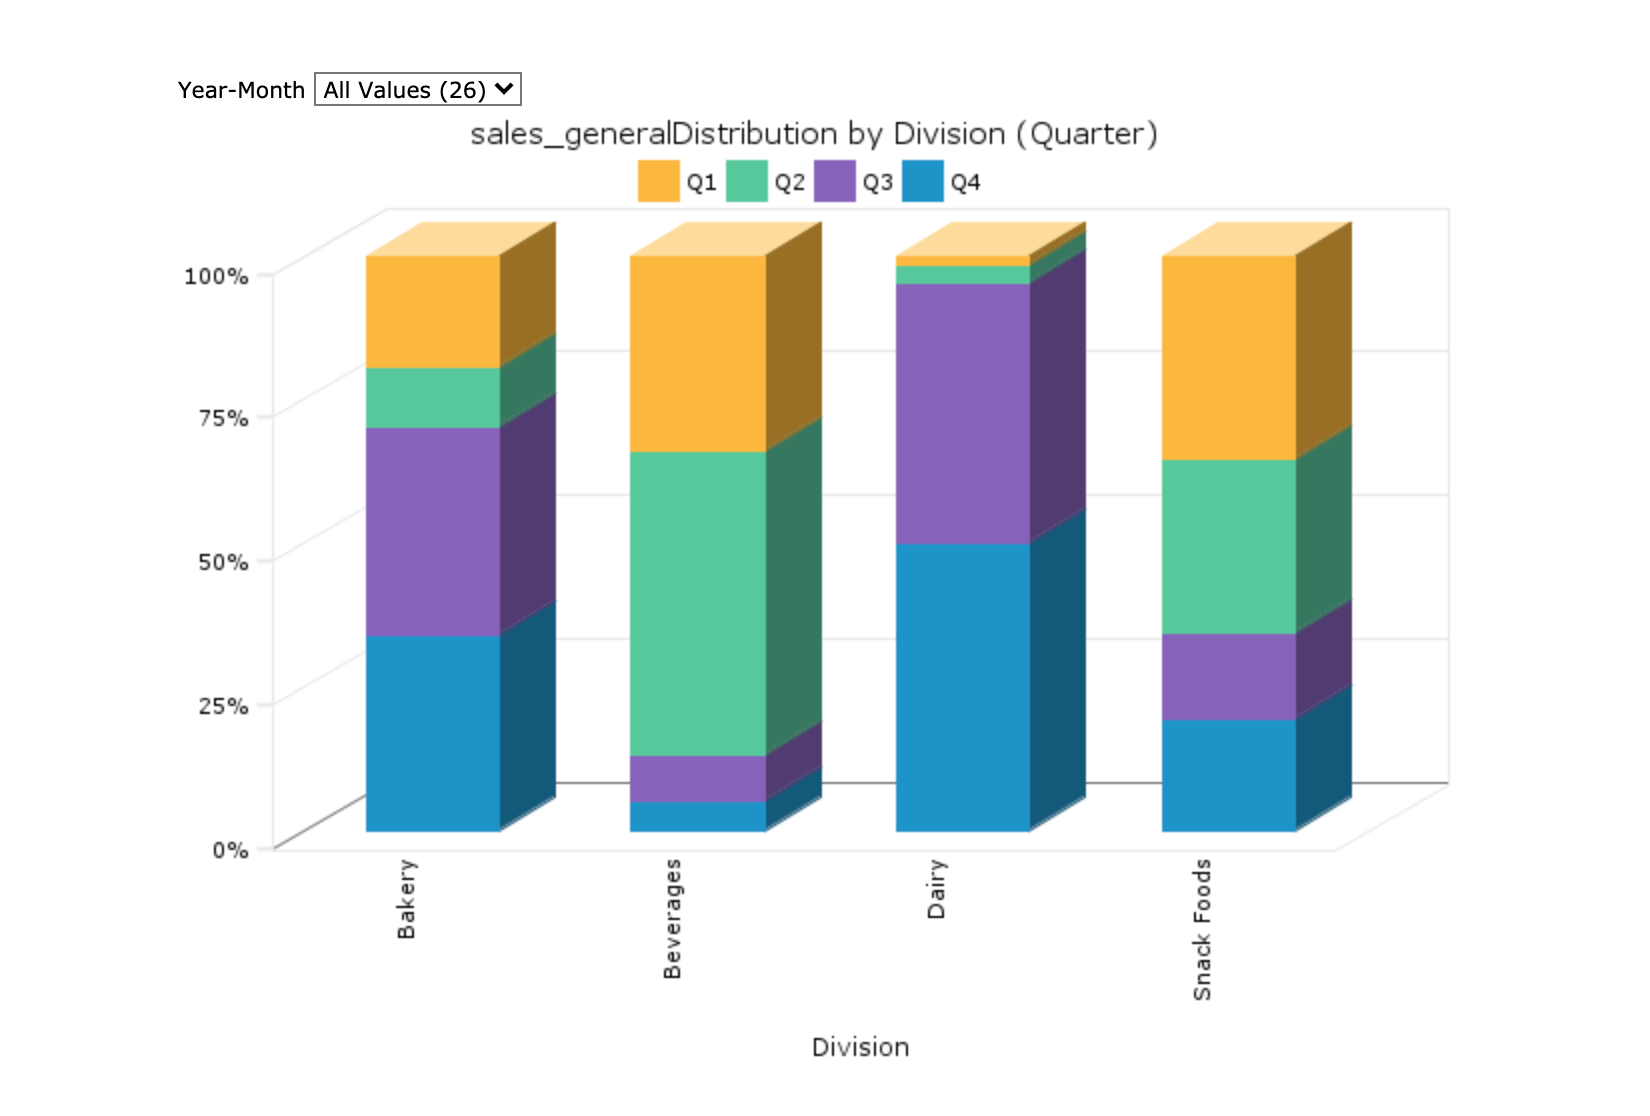
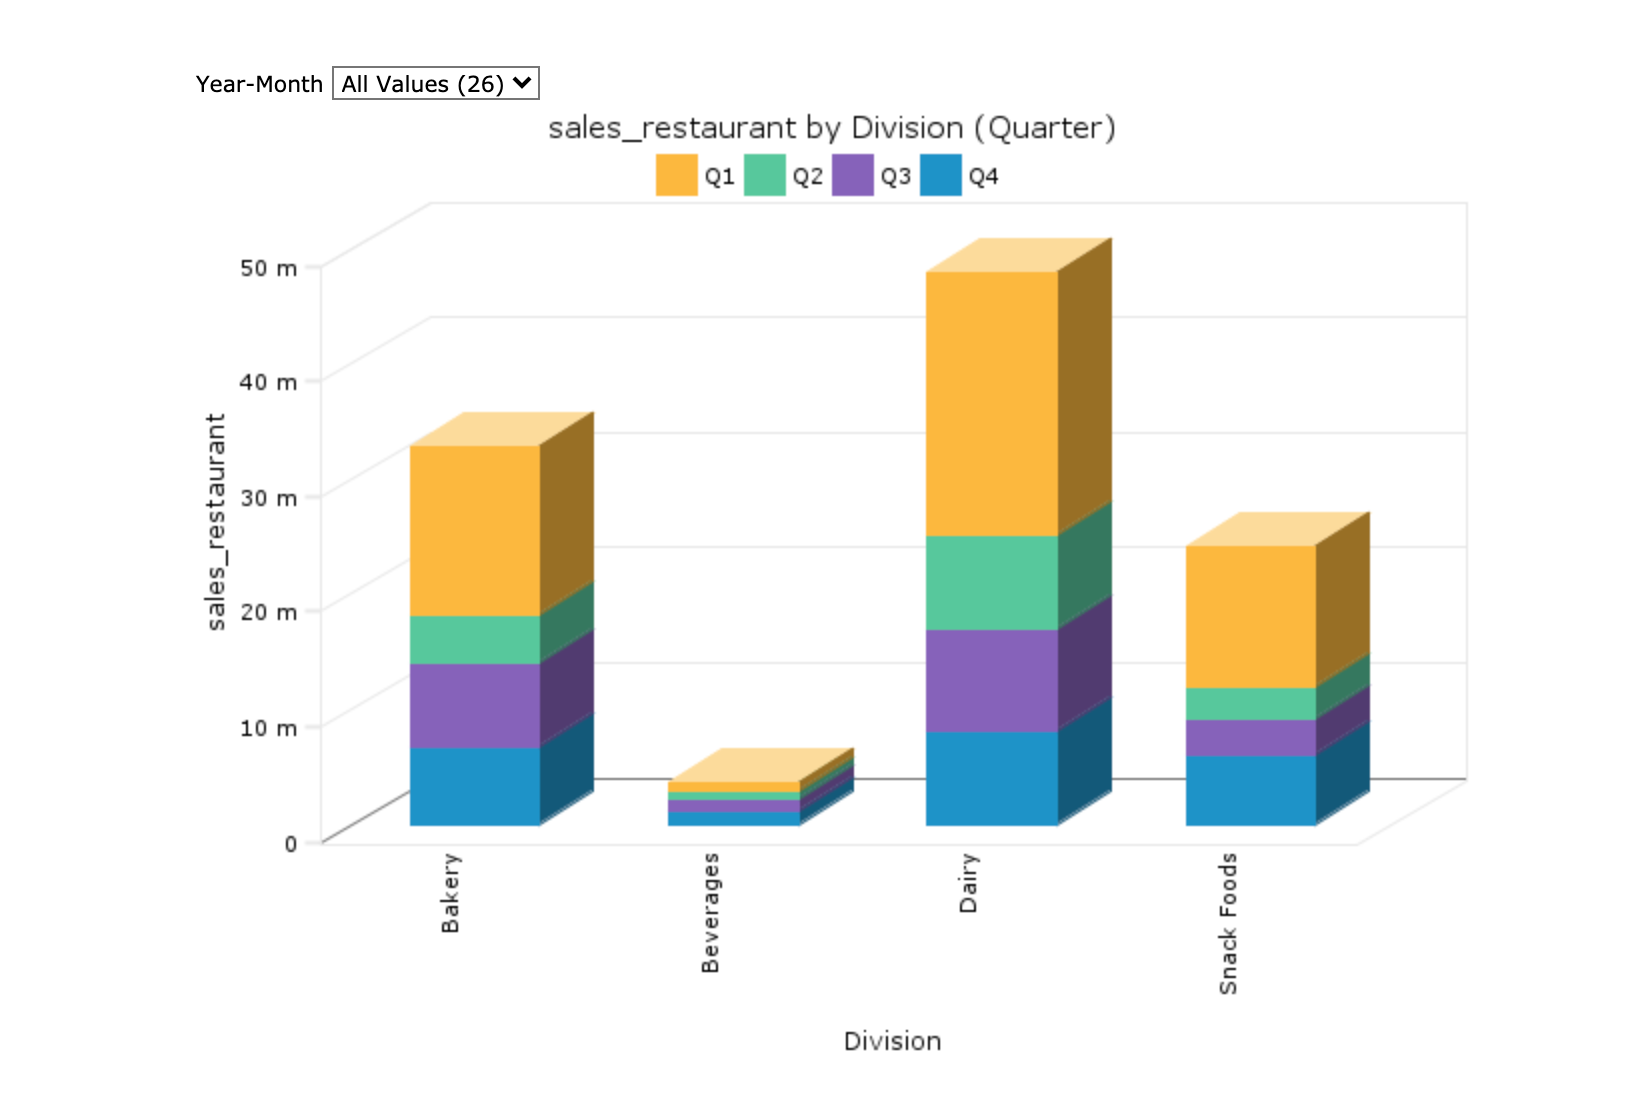
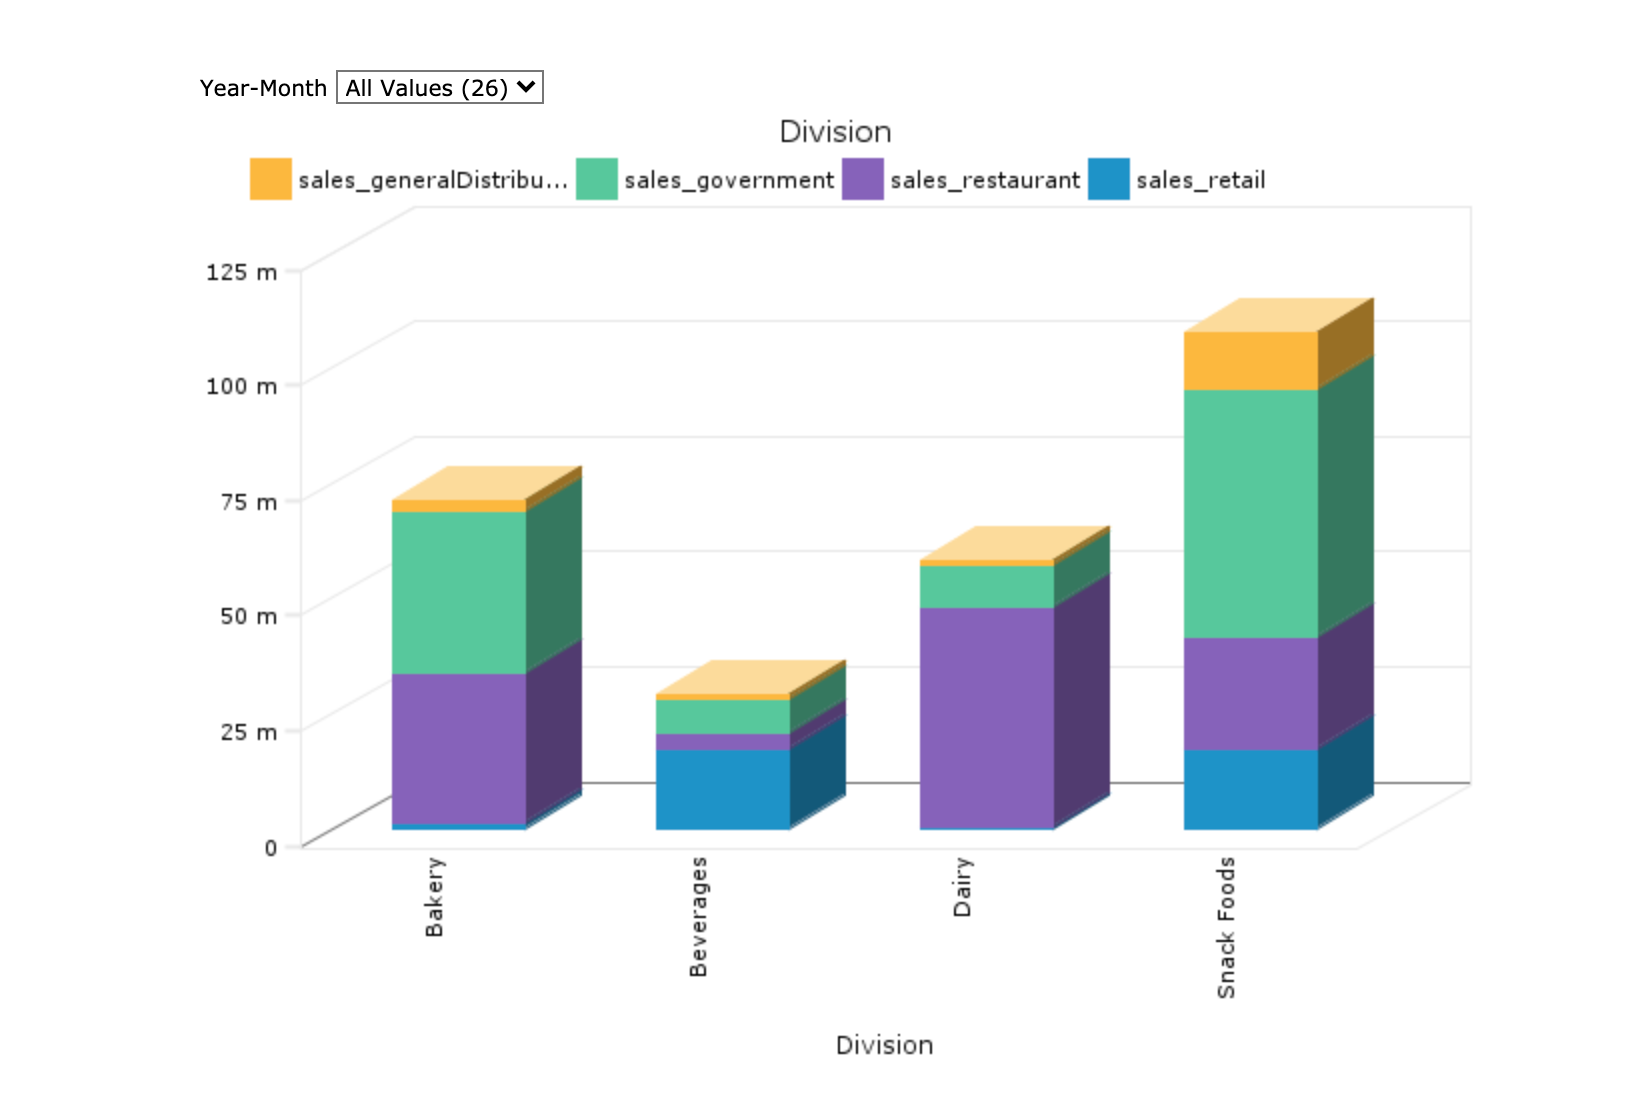
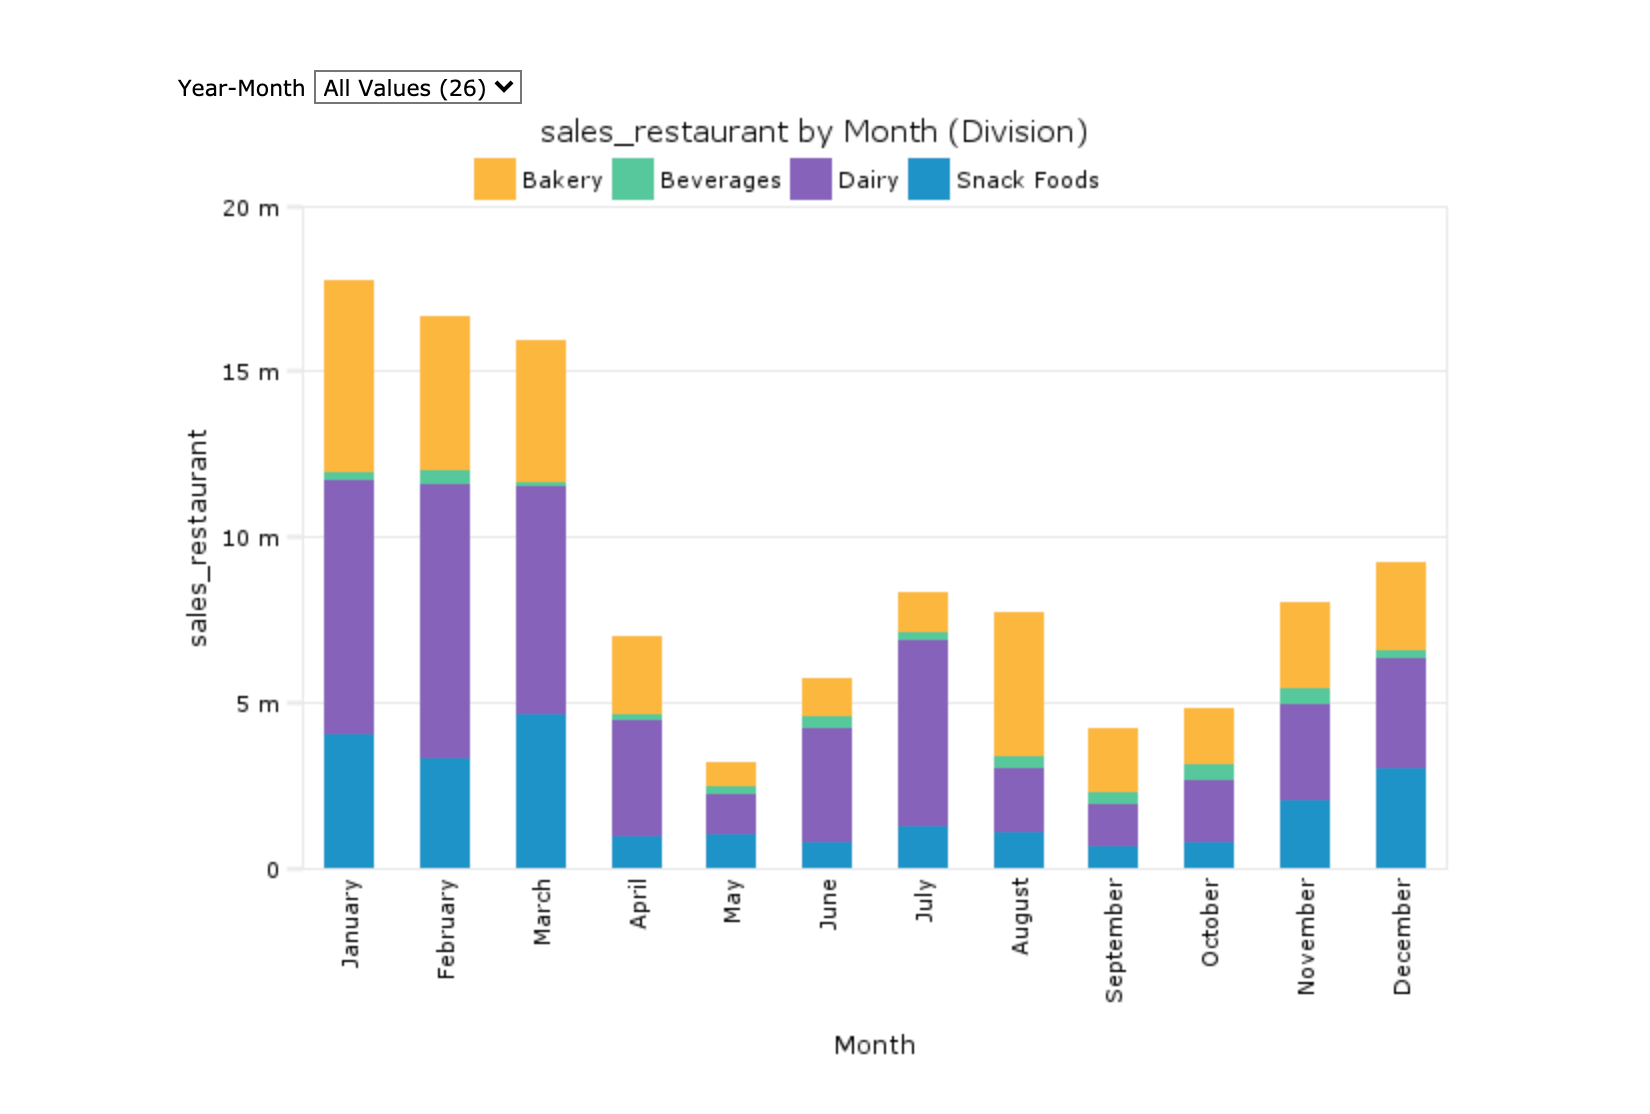
Bar Stack Plot
Stack plot graphs display summary values in a stacked format.
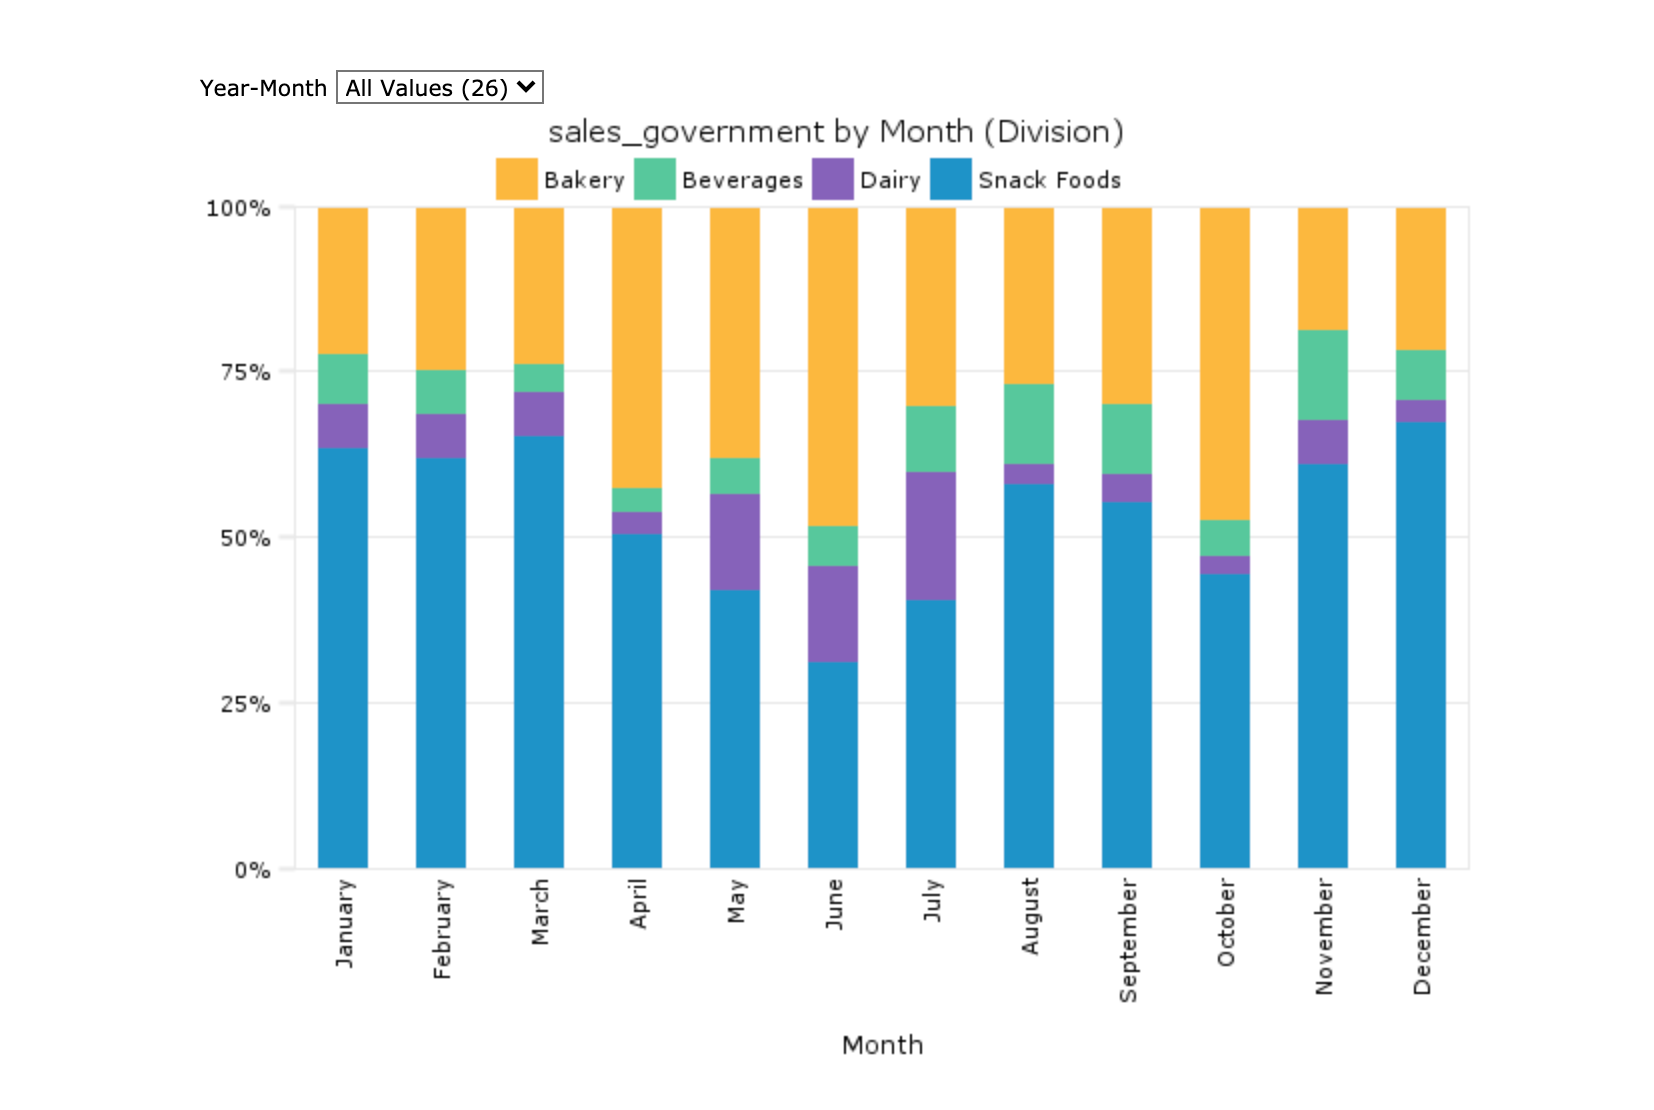
Percentage Stack Plot
Stack plot graphs display summary values in a stacked format.
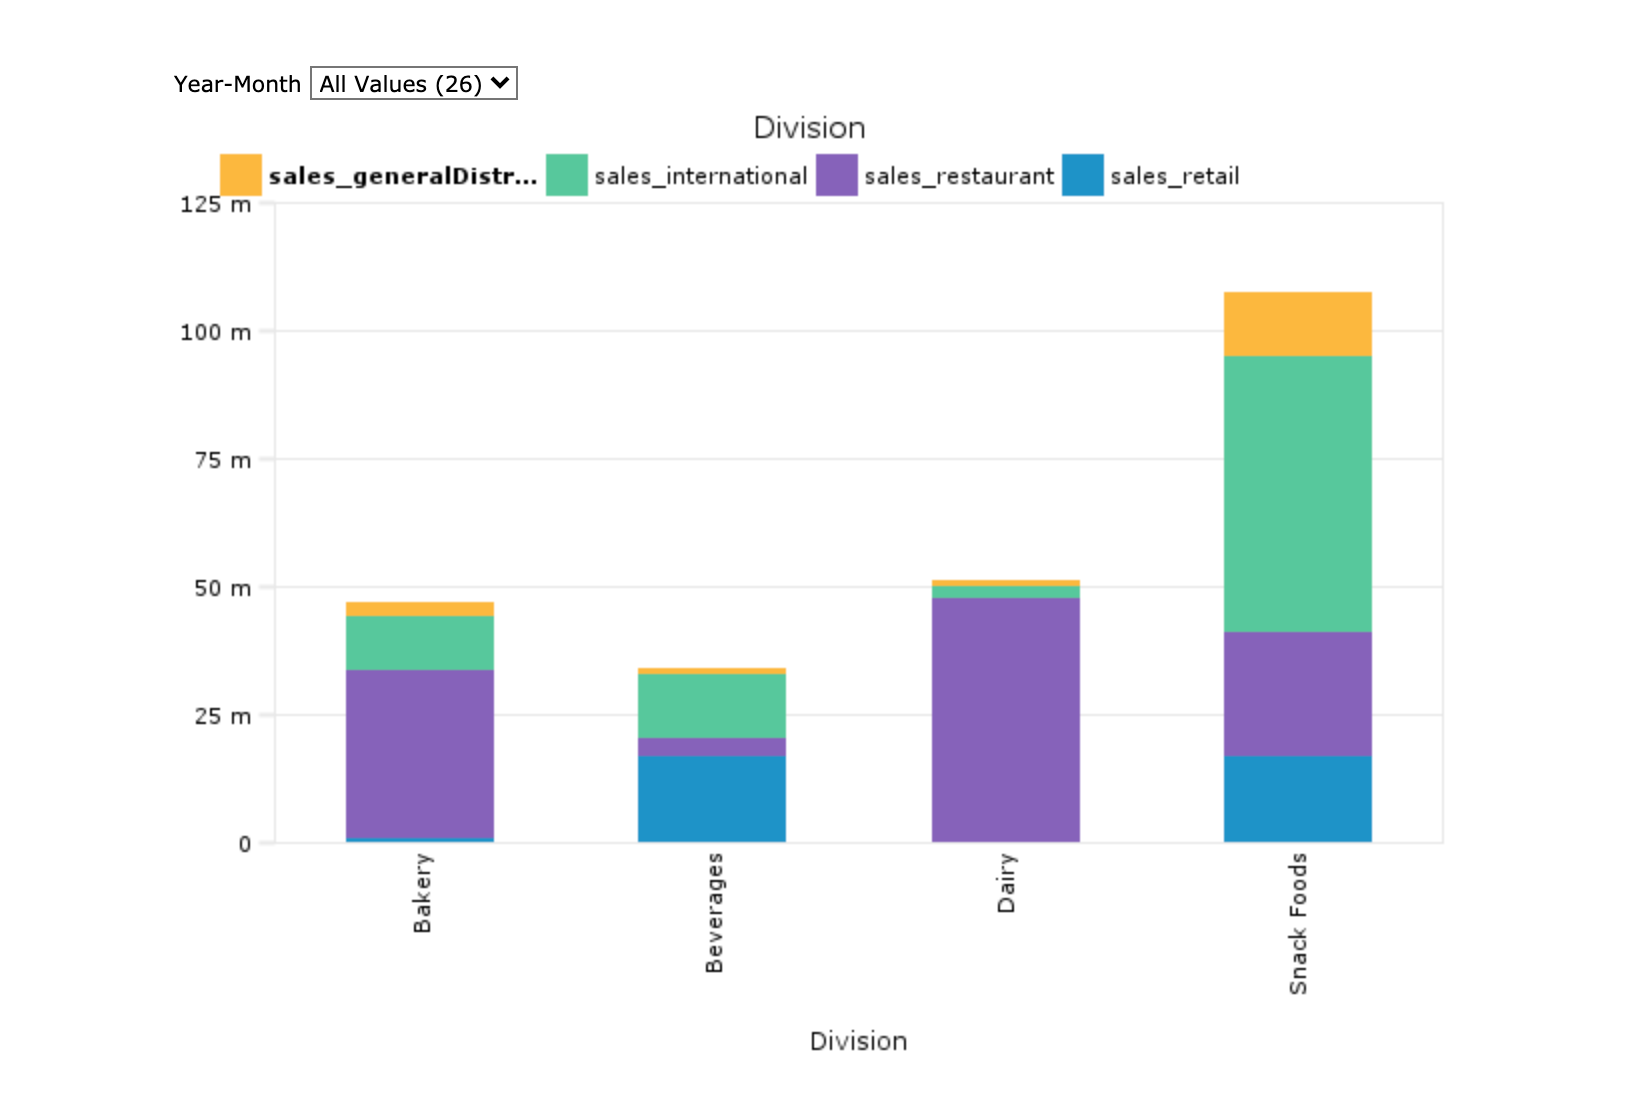
Summary Stack Plot
Stack plot graphs display summary values in a stacked format.
3-D Bar Stack Plot
Stack plot graphs display summary values in a stacked format.
3-D Percentage Stack Plot
Stack plot graphs display summary values in a stacked format.
3-D Summary Stack Plot
Stack plot graphs display summary values in a stacked format.
Bubbles (2)

ProDiver
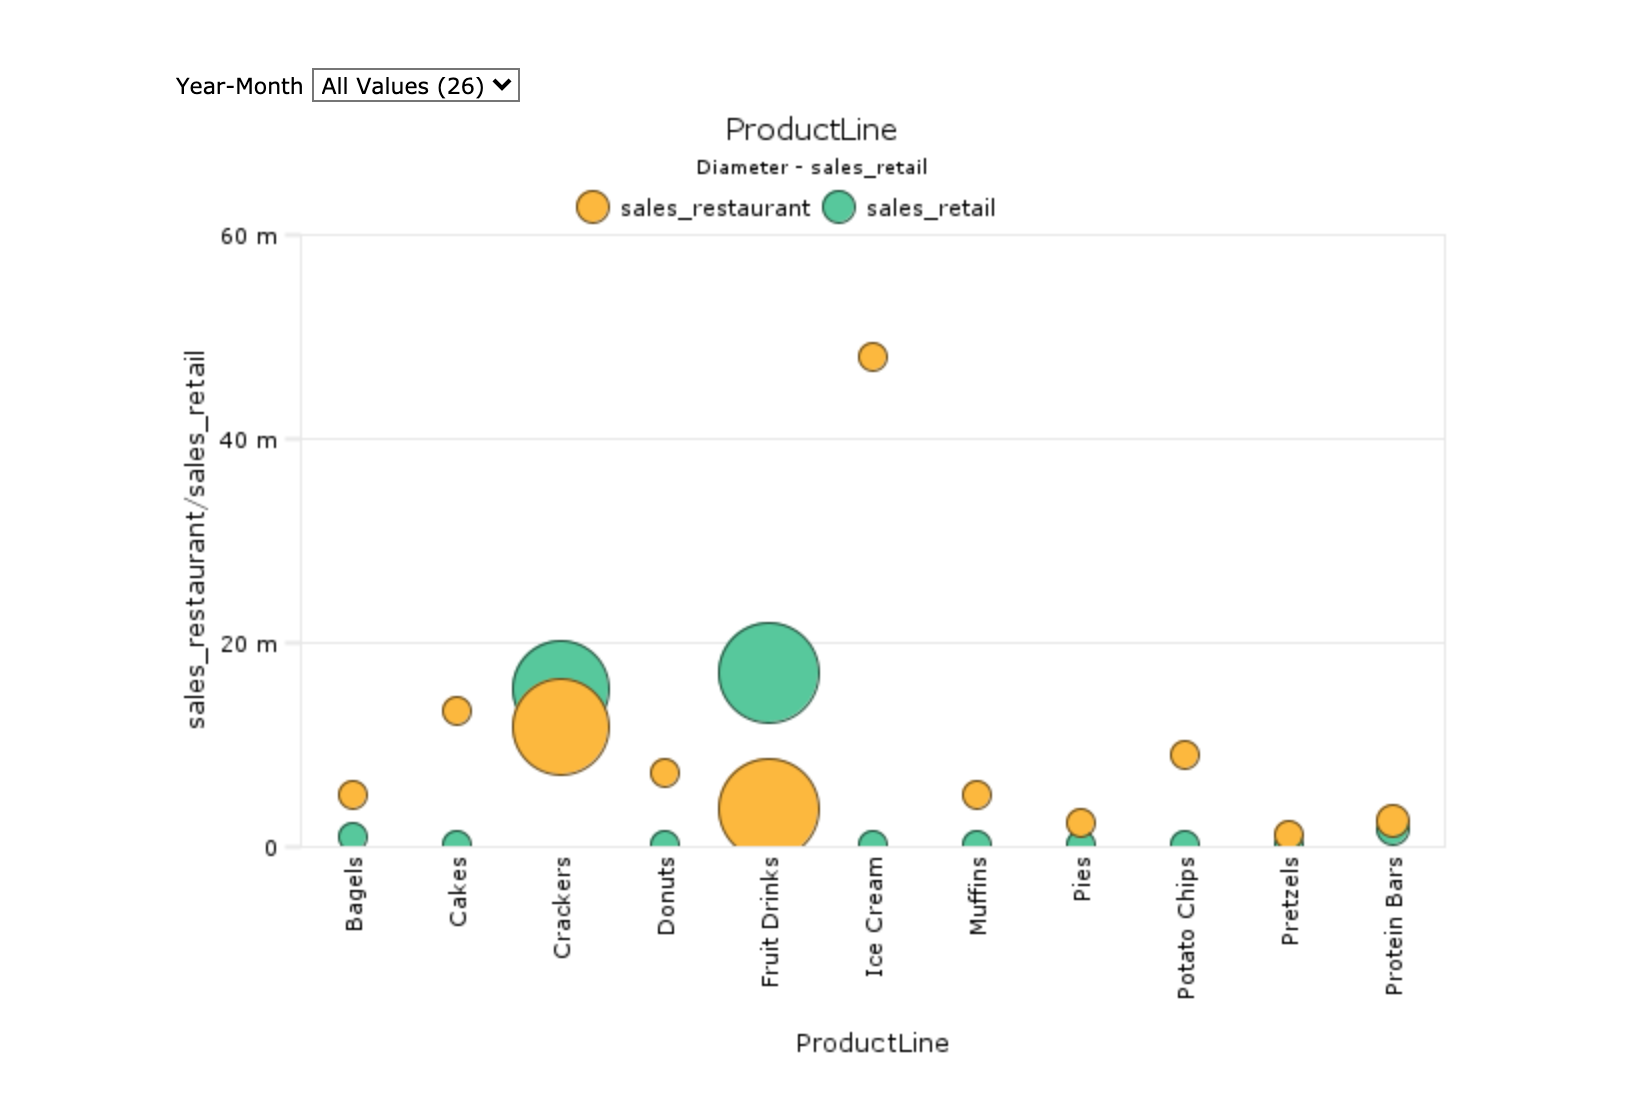
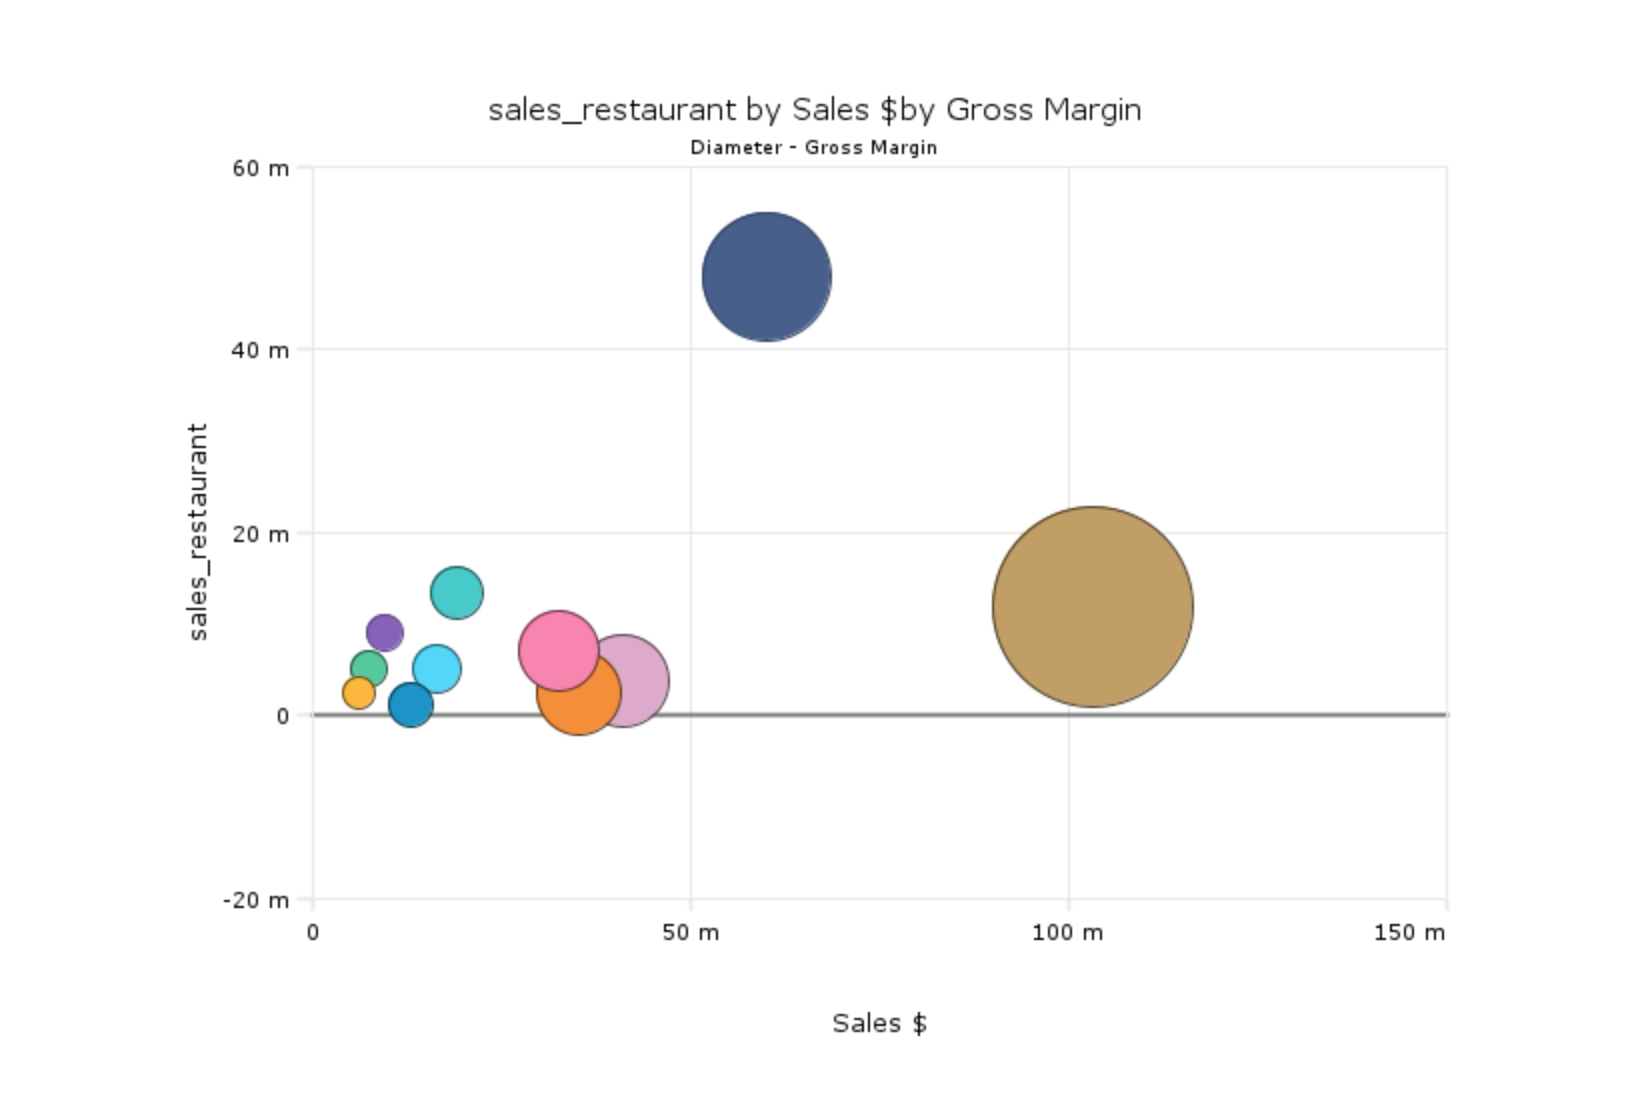
Bubble Cross Plot
Cross plot graphs shows data that pertains to two dimensions simultaneously.
Linear Bubble Graph
Cross plot graphs shows data that pertains to two dimensions simultaneously.
Calendars (3)

ProDiver
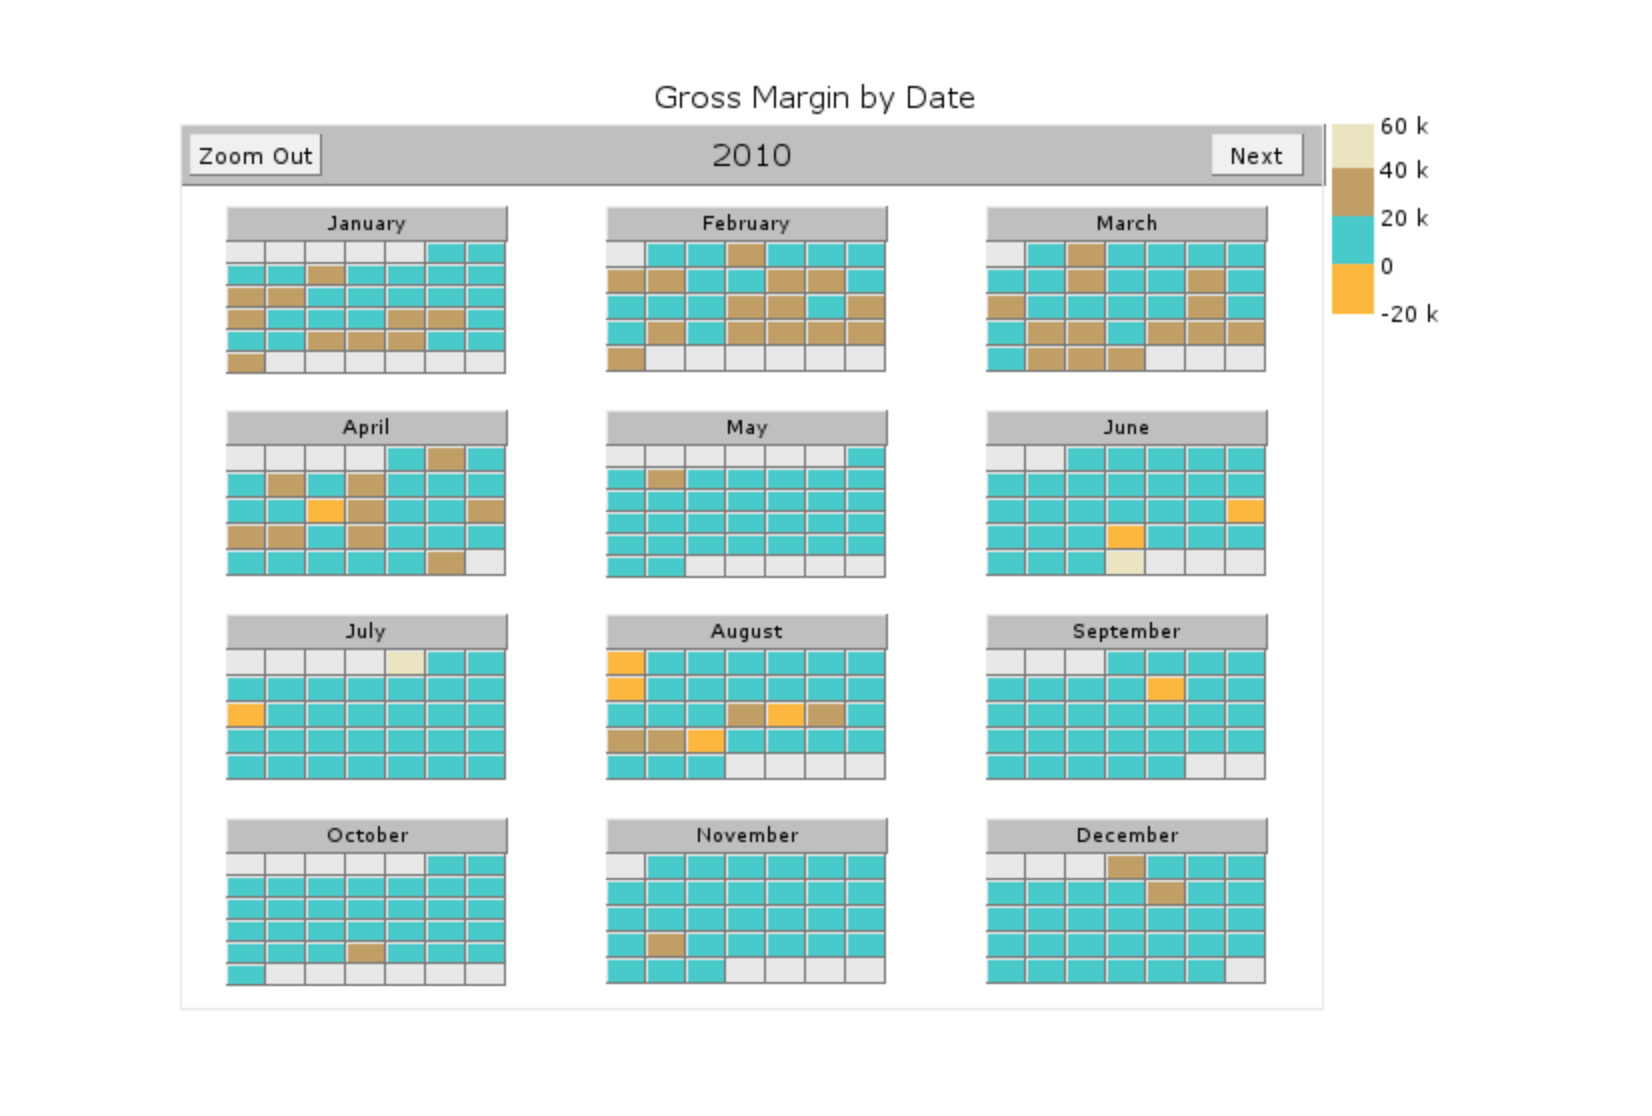
Calendar View with Bar Plots
Calendar View with Bar Plots—Shows a bar (or point) representing the relative size of summary data on each day of the calendar.
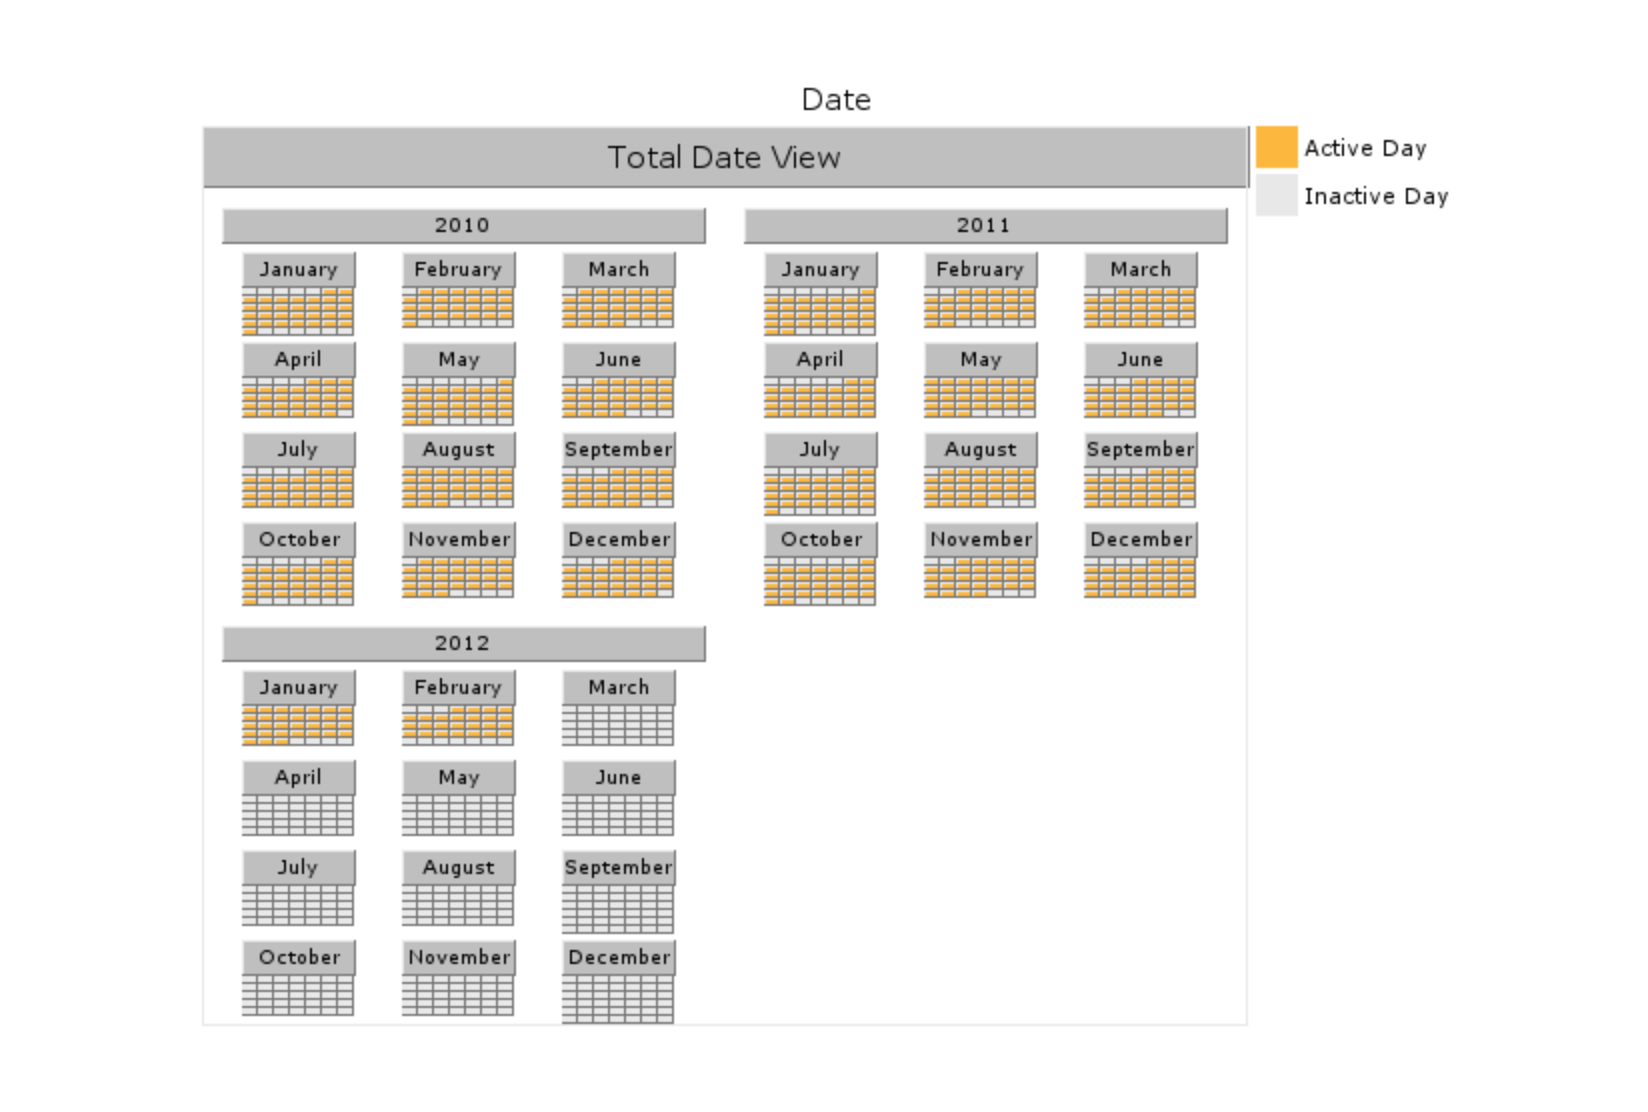
Calendar Active View
Calendar Active View—Shows whether or not summary data is available for each day
Calendar Sorted View
Shows color-coded data that indicates a range of values
Control (7)


ProDiver
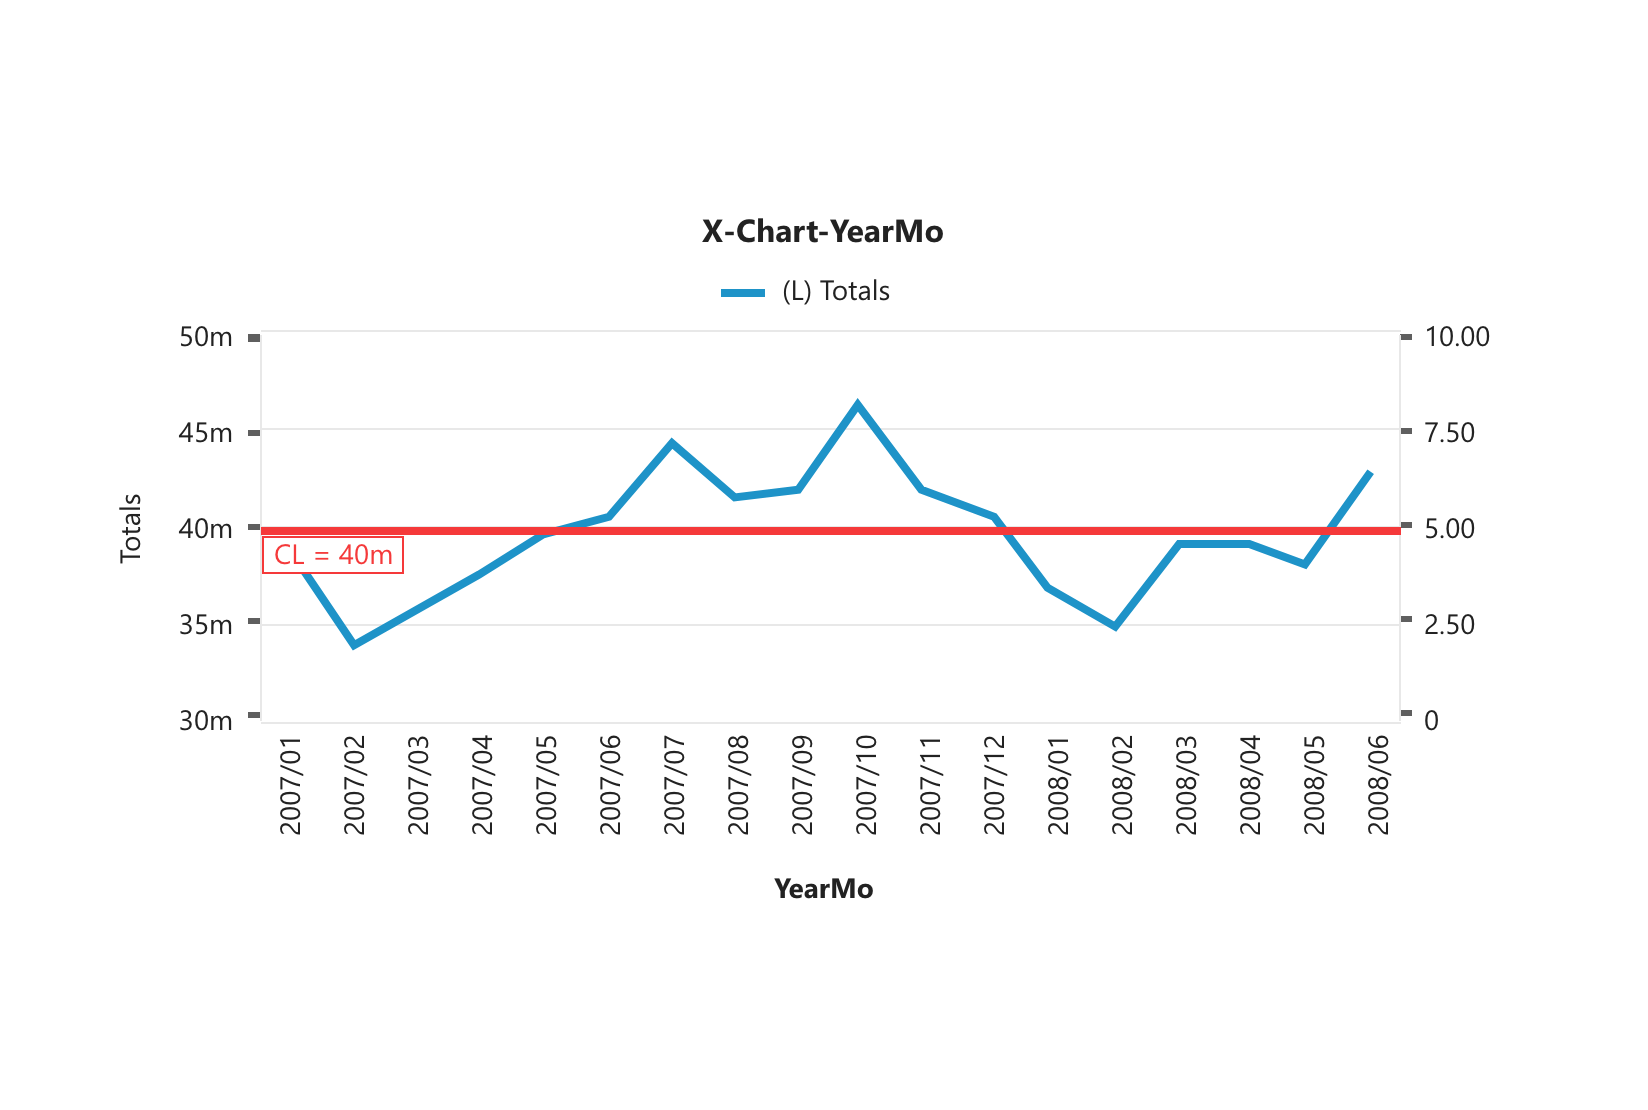
X-Chart
Control chart graphs show statistical background data for a single dimension. They can be used to observe trends.
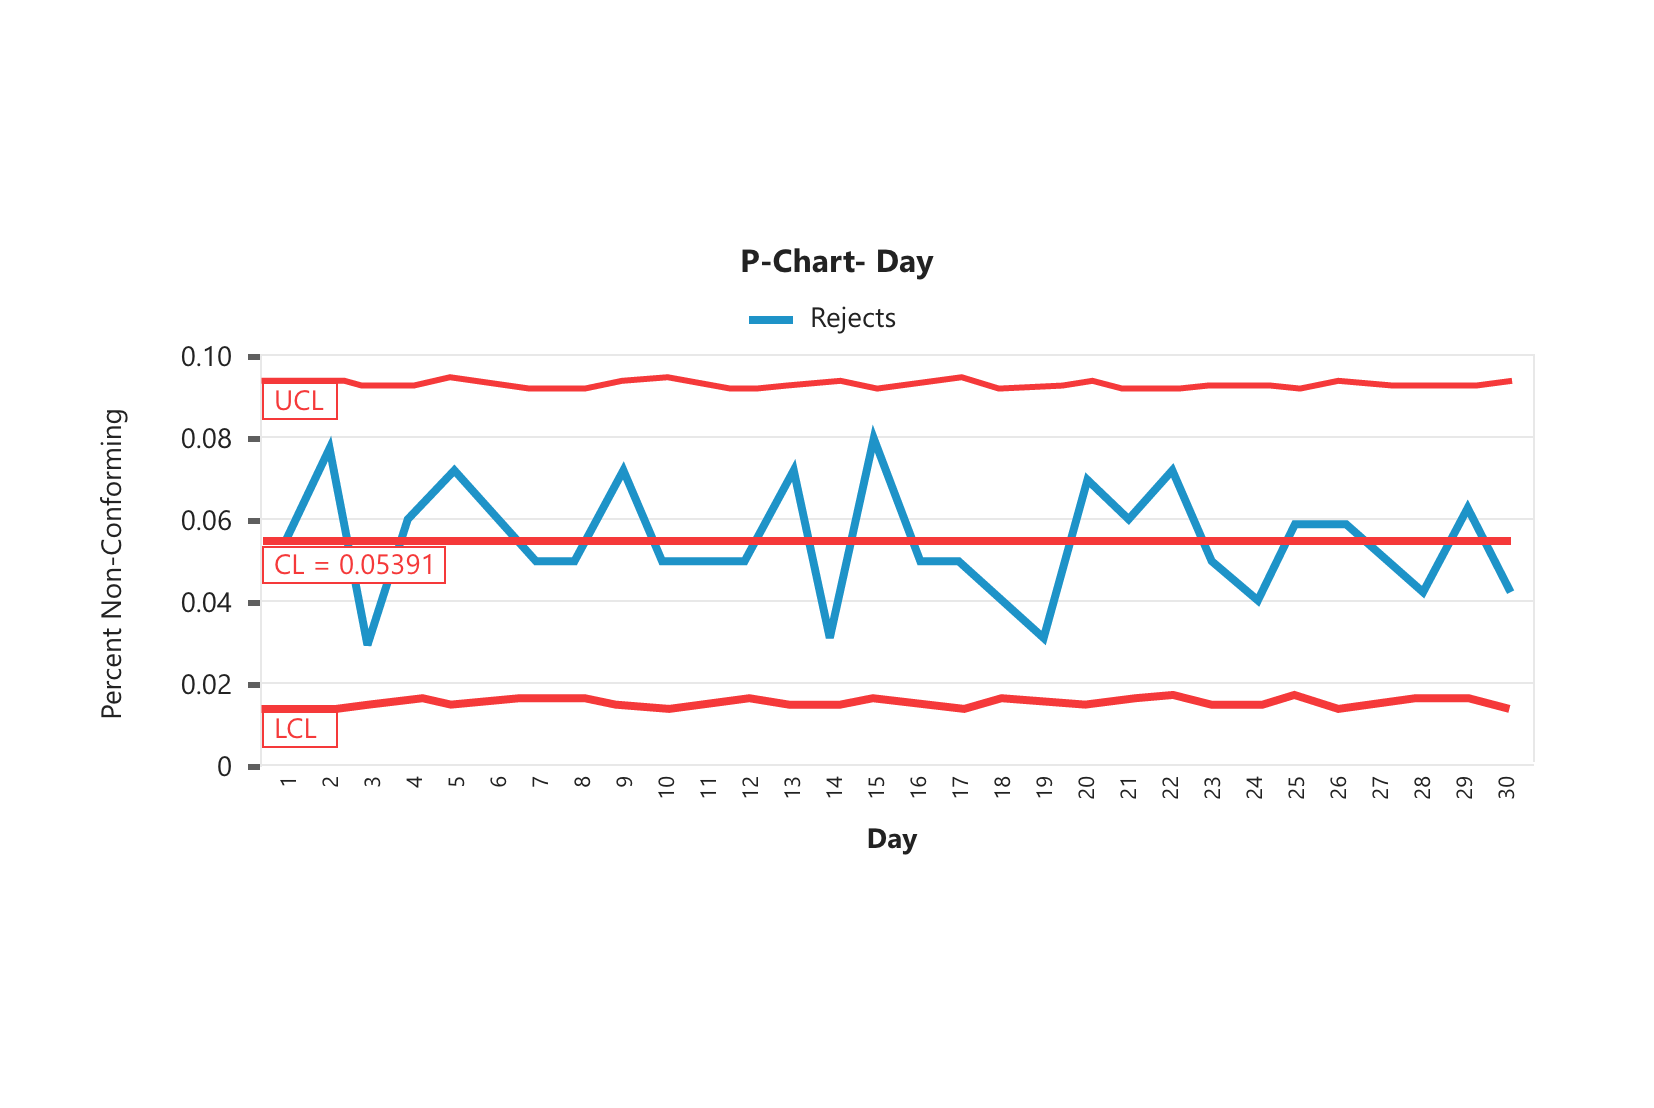
P-Chart
Control chart graphs show statistical background data for a single dimension. They can be used to observe trends.
NP-Chart
Control chart graphs show statistical background data for a single dimension. They can be used to observe trends.
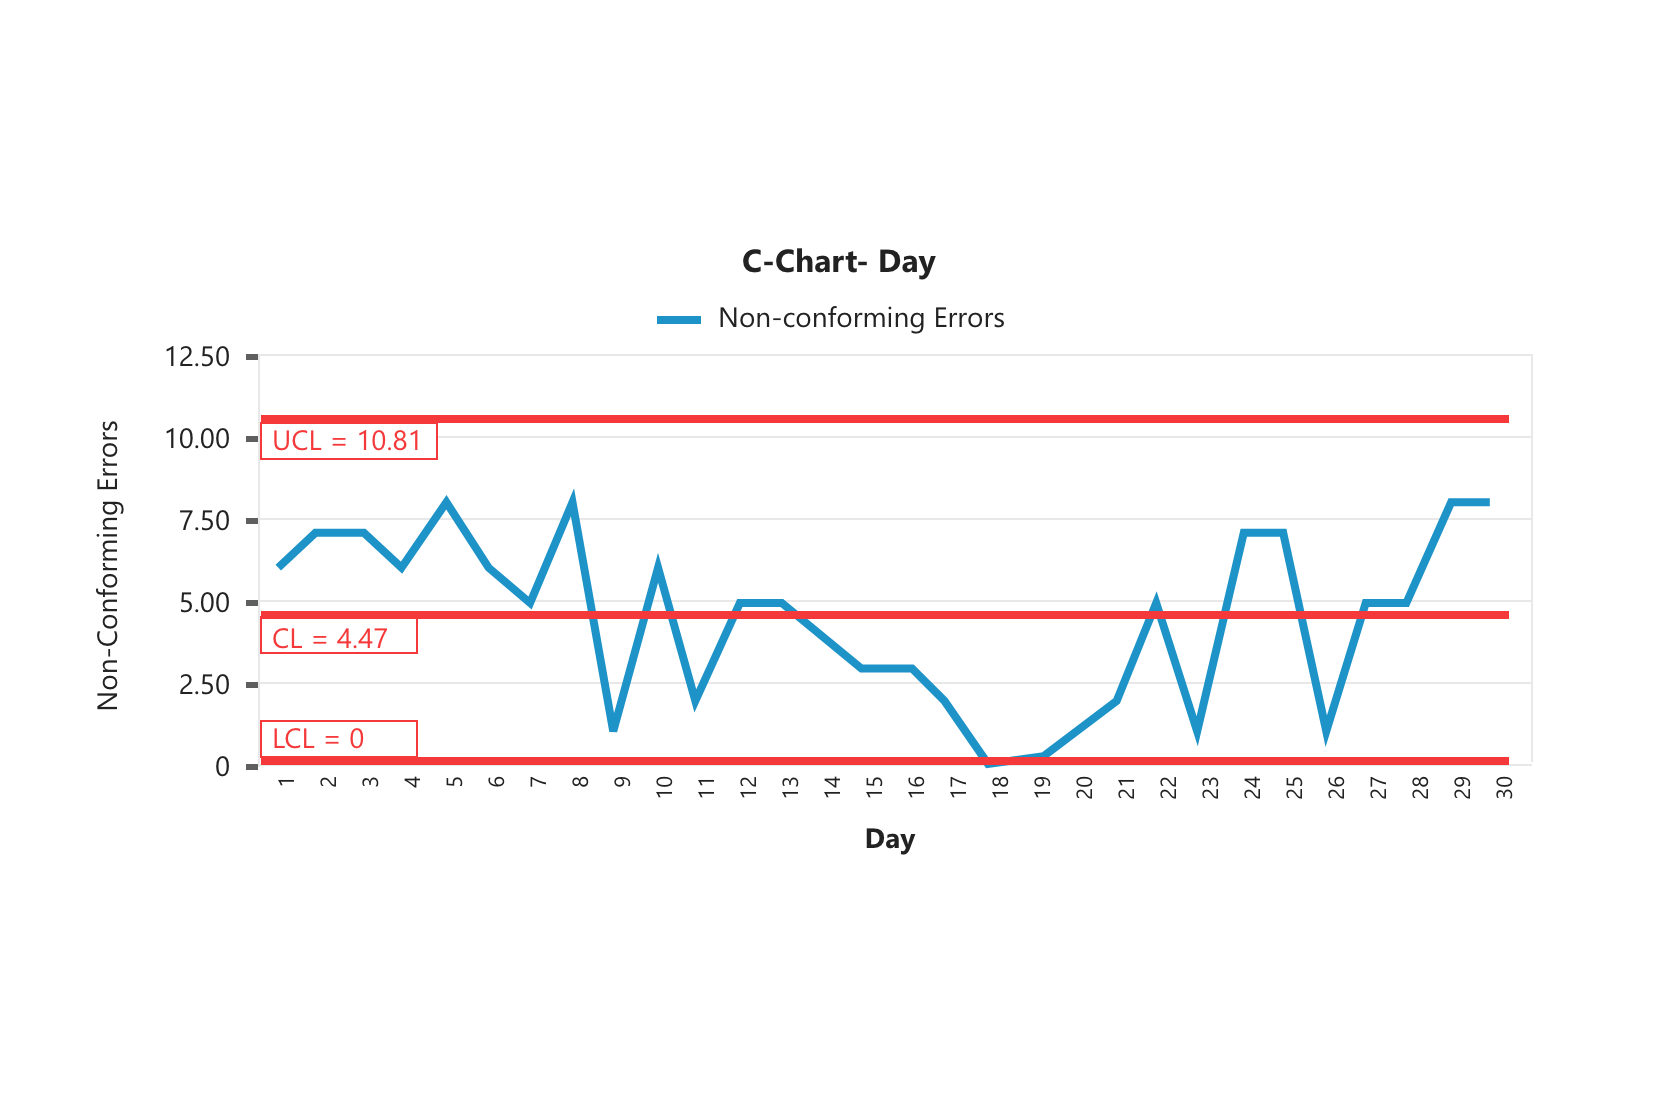
C-Chart
Control chart graphs show statistical background data for a single dimension. They can be used to observe trends.
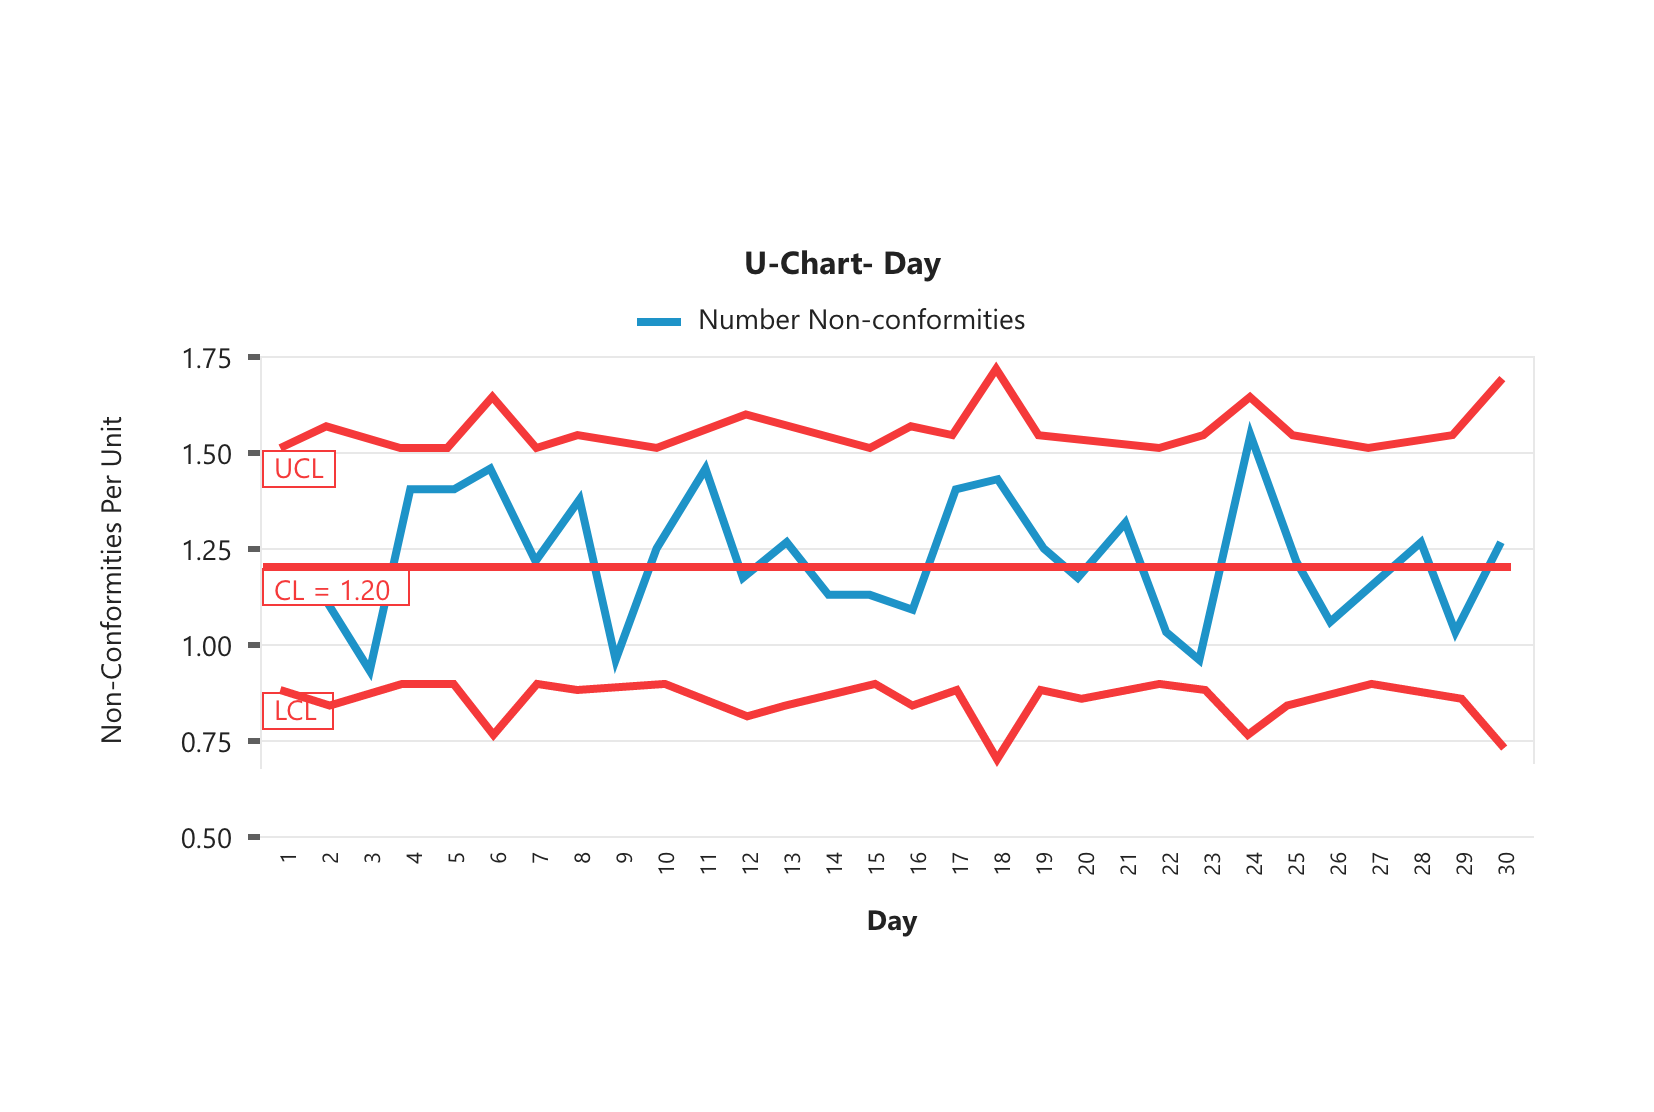
U-Chart
Control chart graphs show statistical background data for a single dimension. They can be used to observe trends.
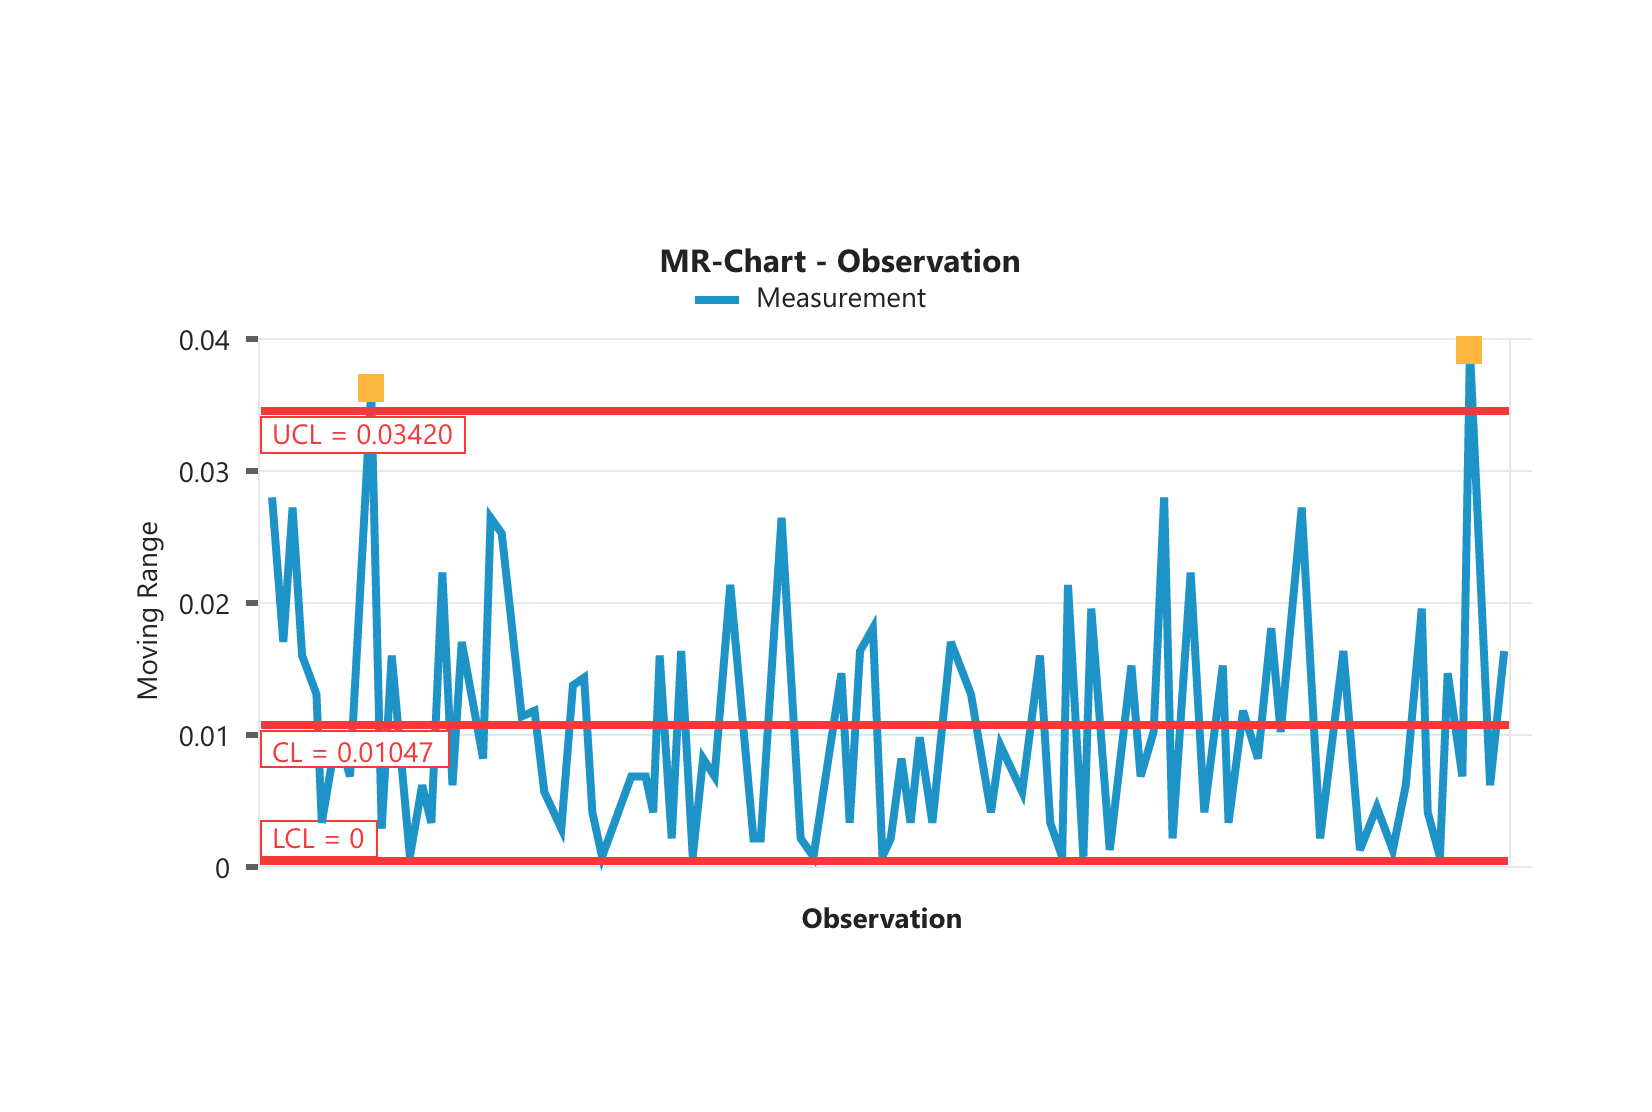
MR-Chart
Control chart graphs show statistical background data for a single dimension. They can be used to observe trends.
Individual MR-Chart
Control chart graphs show statistical background data for a single dimension. They can be used to observe trends.
Indicators (4)


ProDiver
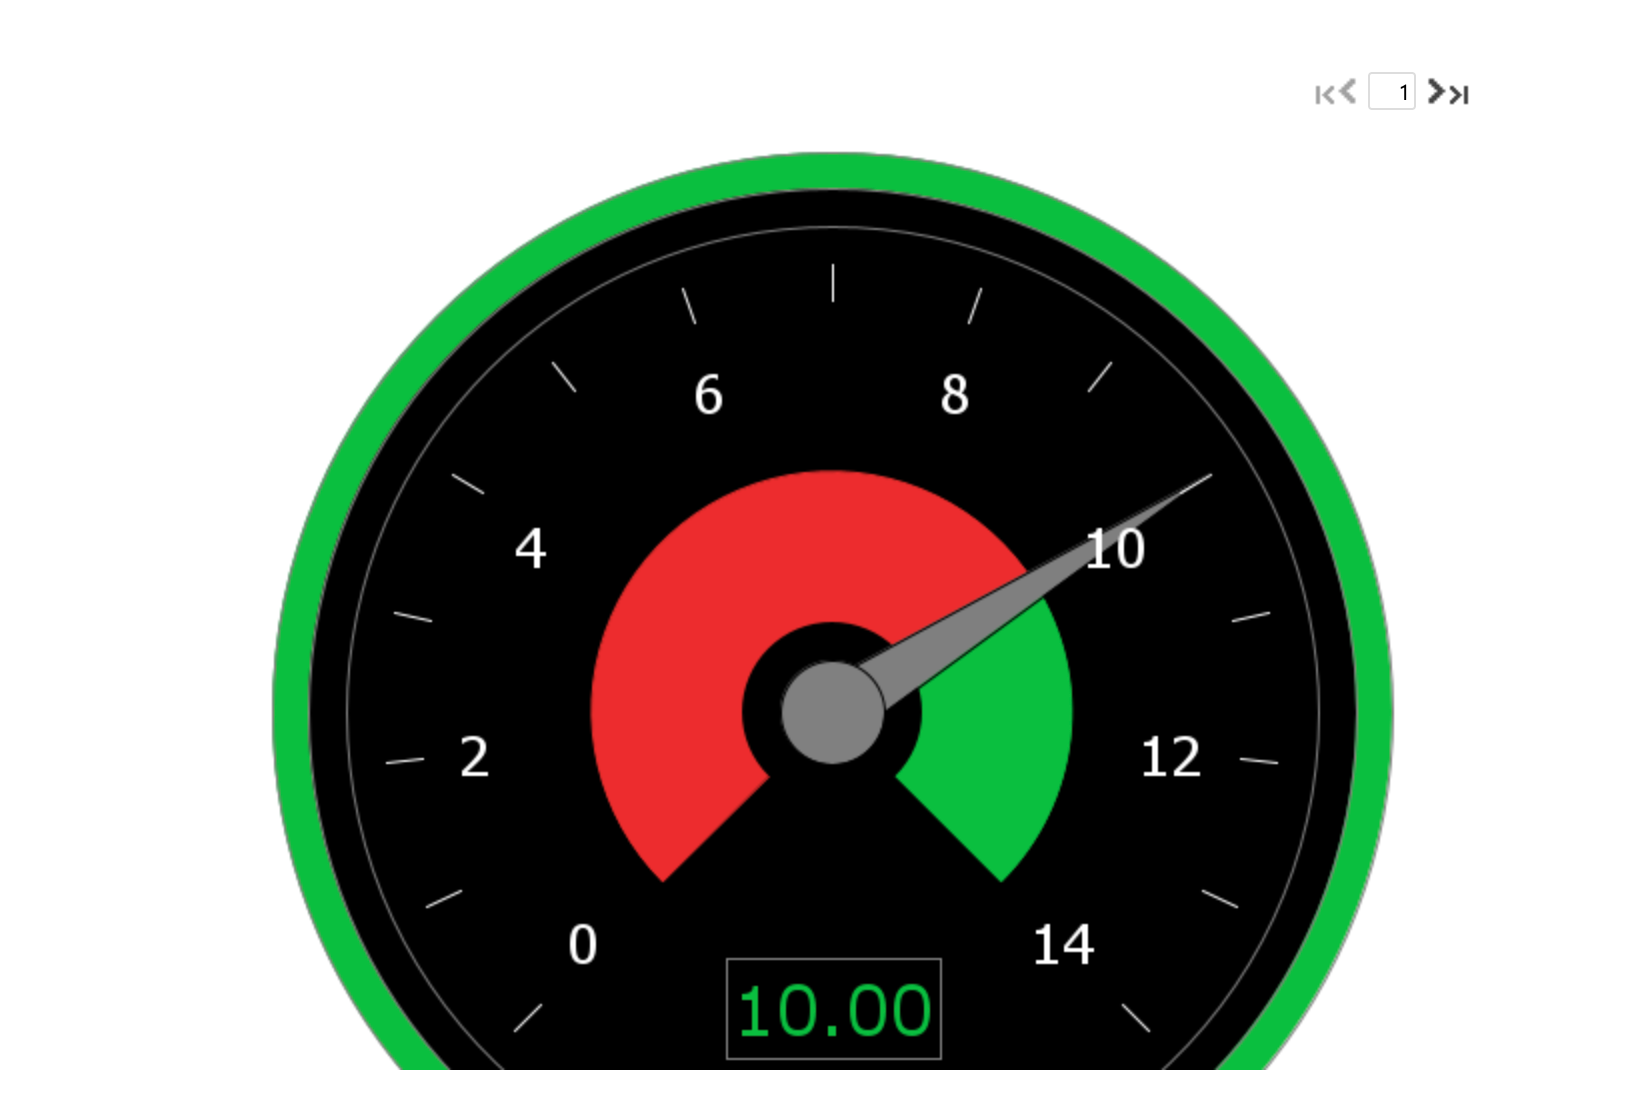
Standard Gauge
A 180° arc with colored performance thresholds and a needle or arrow to indicate in where in the scale the value falls. Use gauges when three ranges are needed. For example, unacceptable, acceptable, and exceptional, and you want to use a scale other than the threshold values.
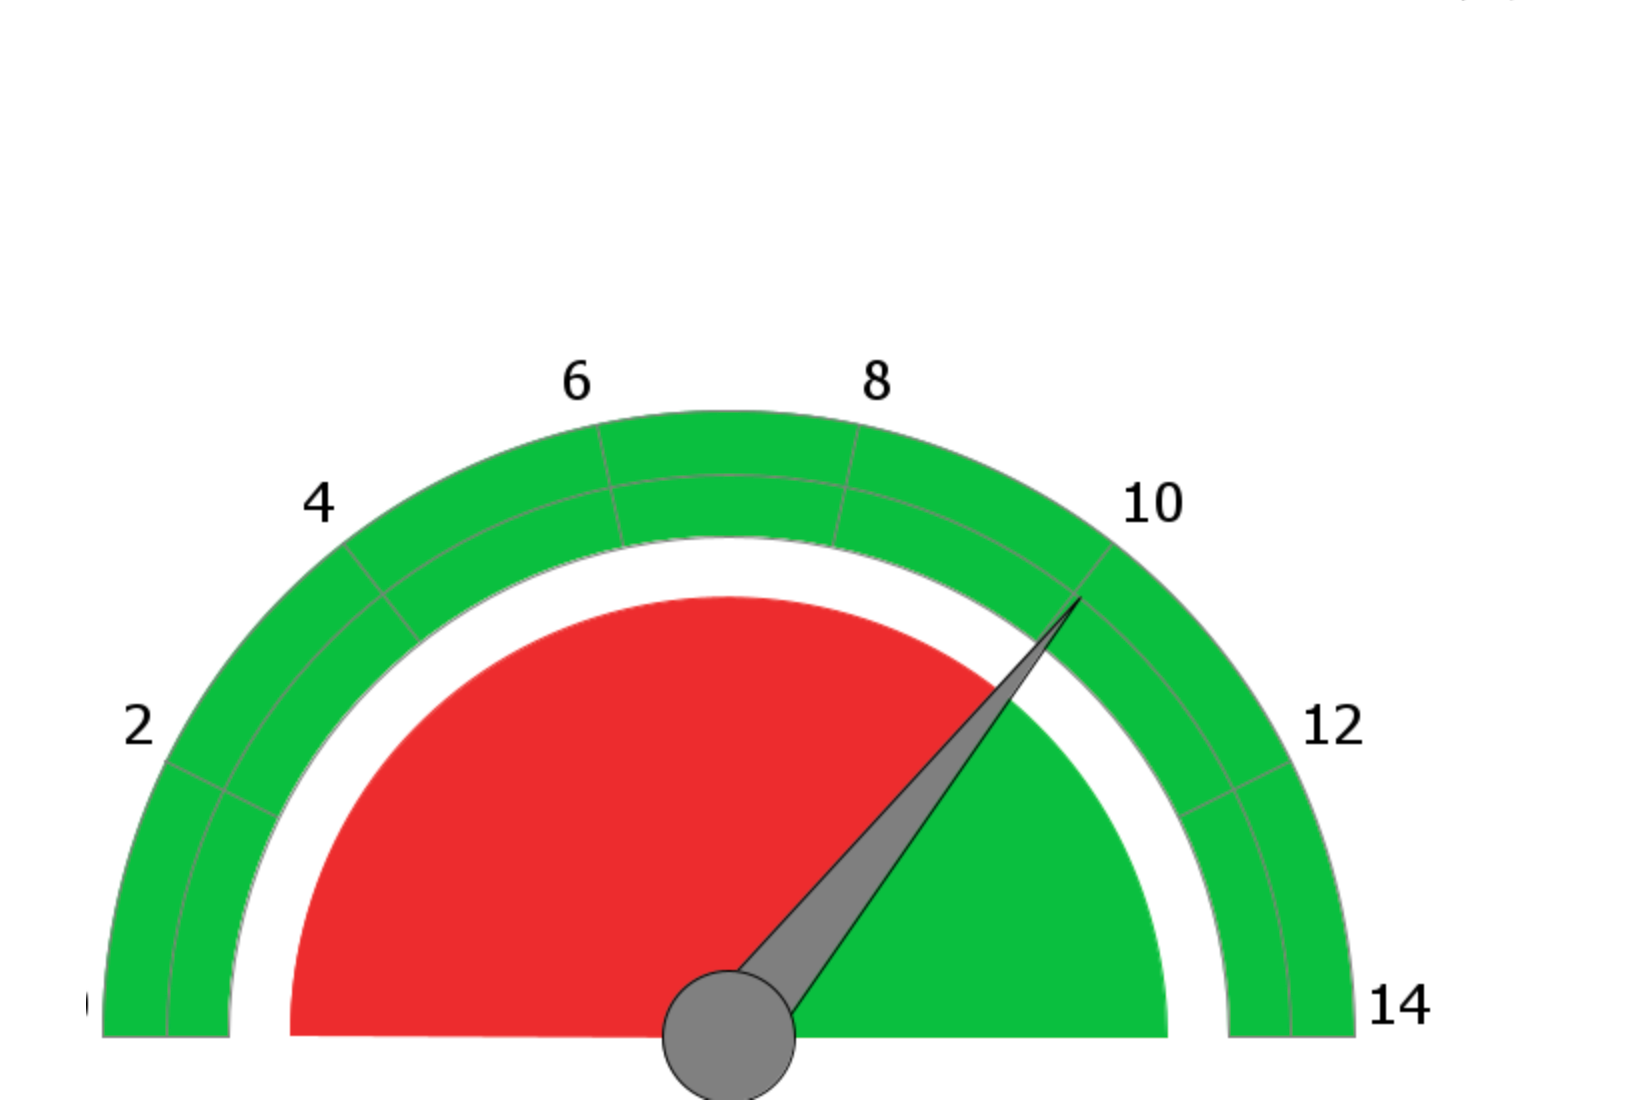
Speedometer
A 240° arc with colored performance thresholds and a needle to indicate where in the scale the value falls.
Image
A designated set of images you can use to display up to four thresholds. Link each range to a different image.
Thermometer
A thermometer with colored performance thresholds.
Lines (7)

ProDiver
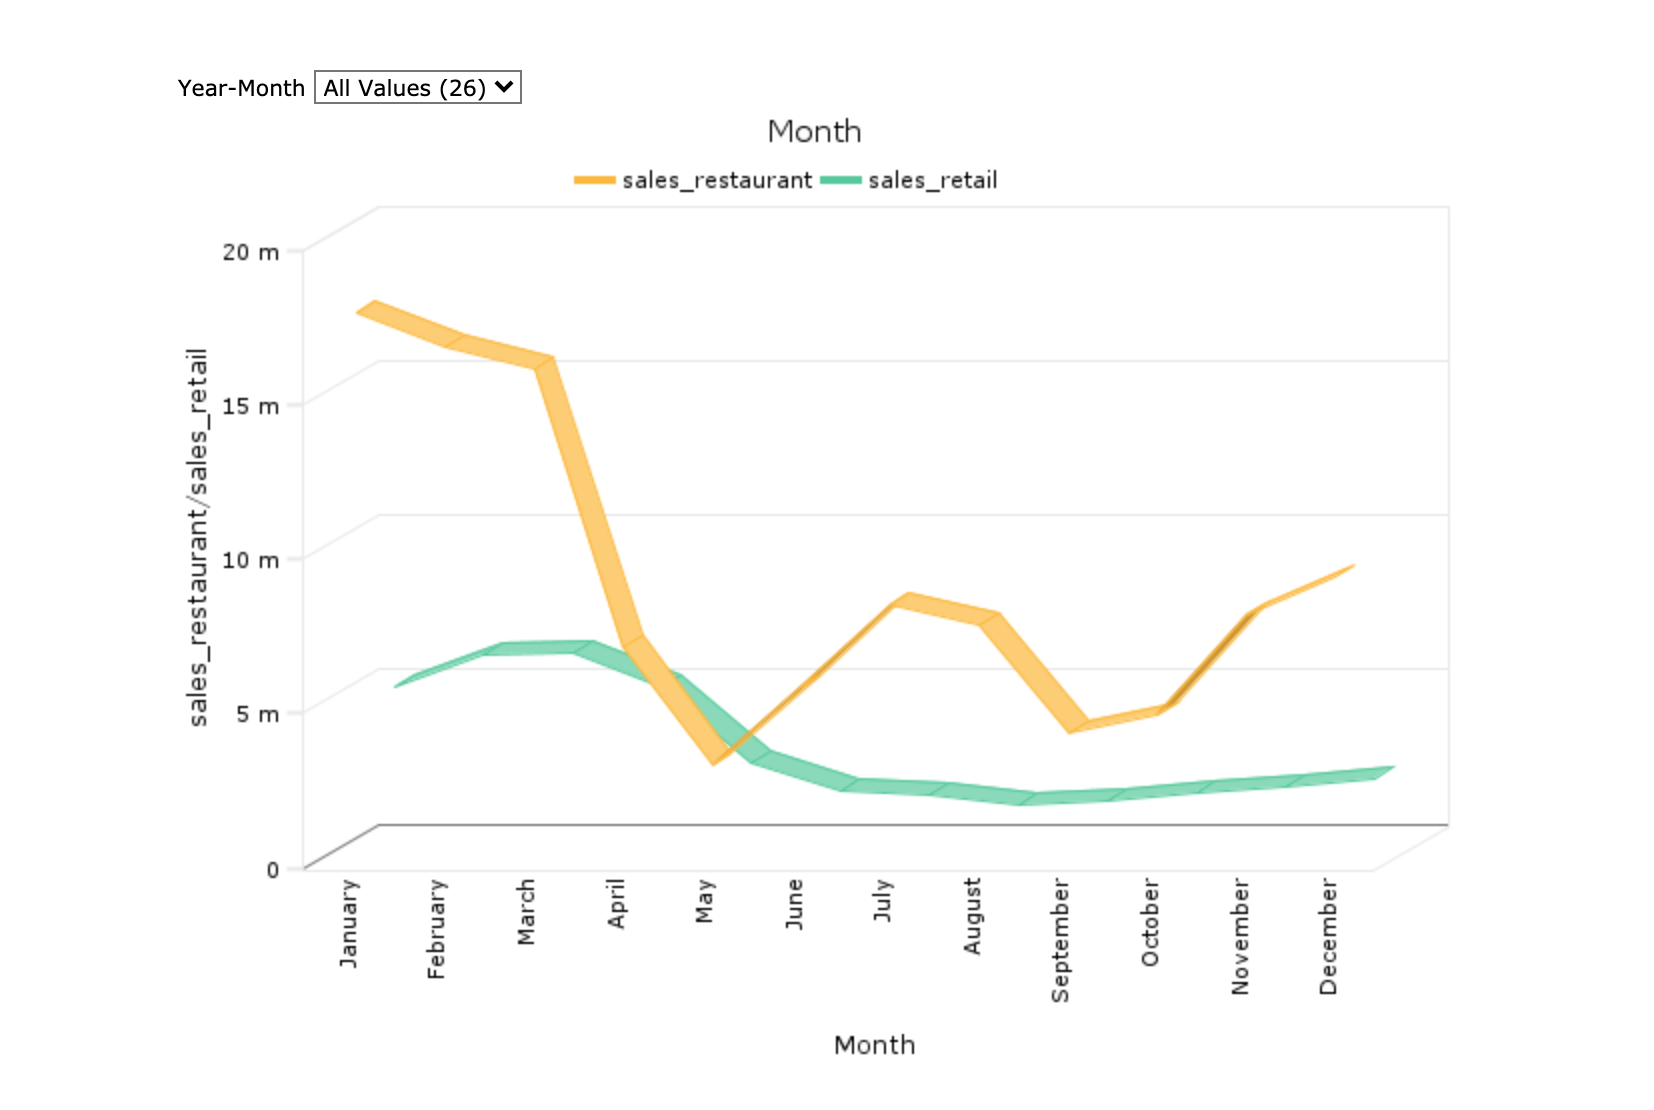
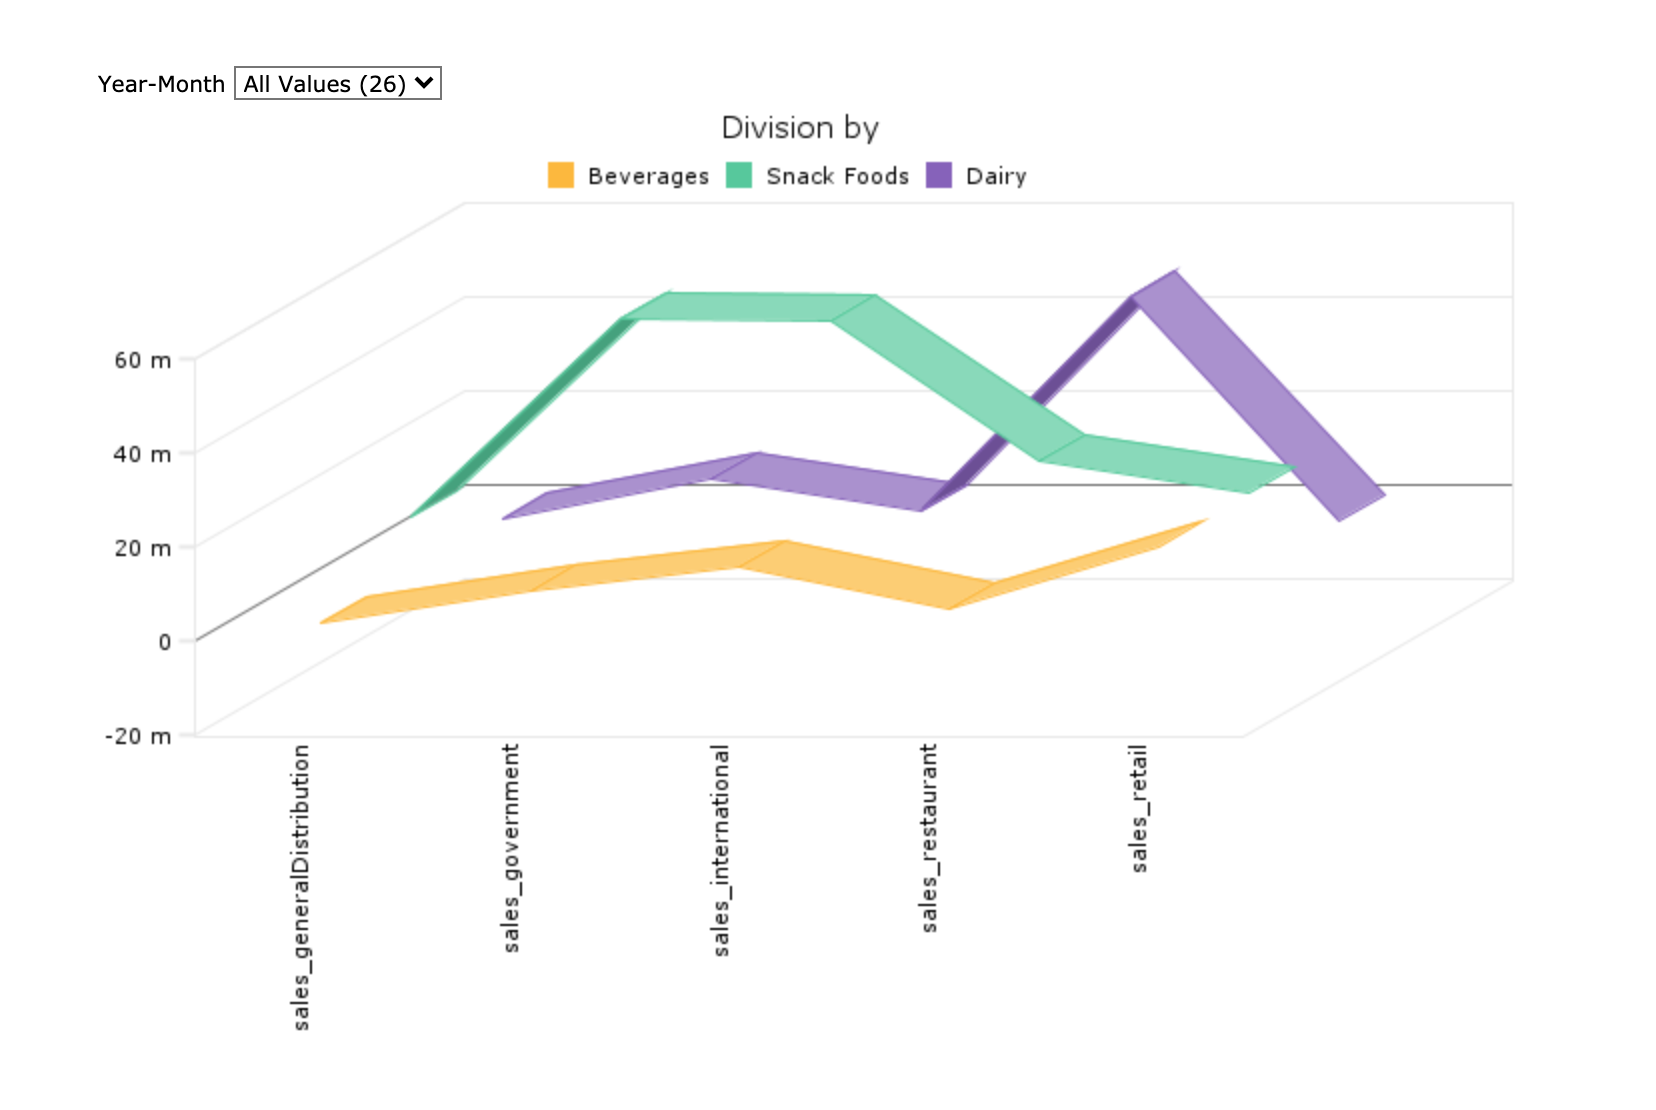
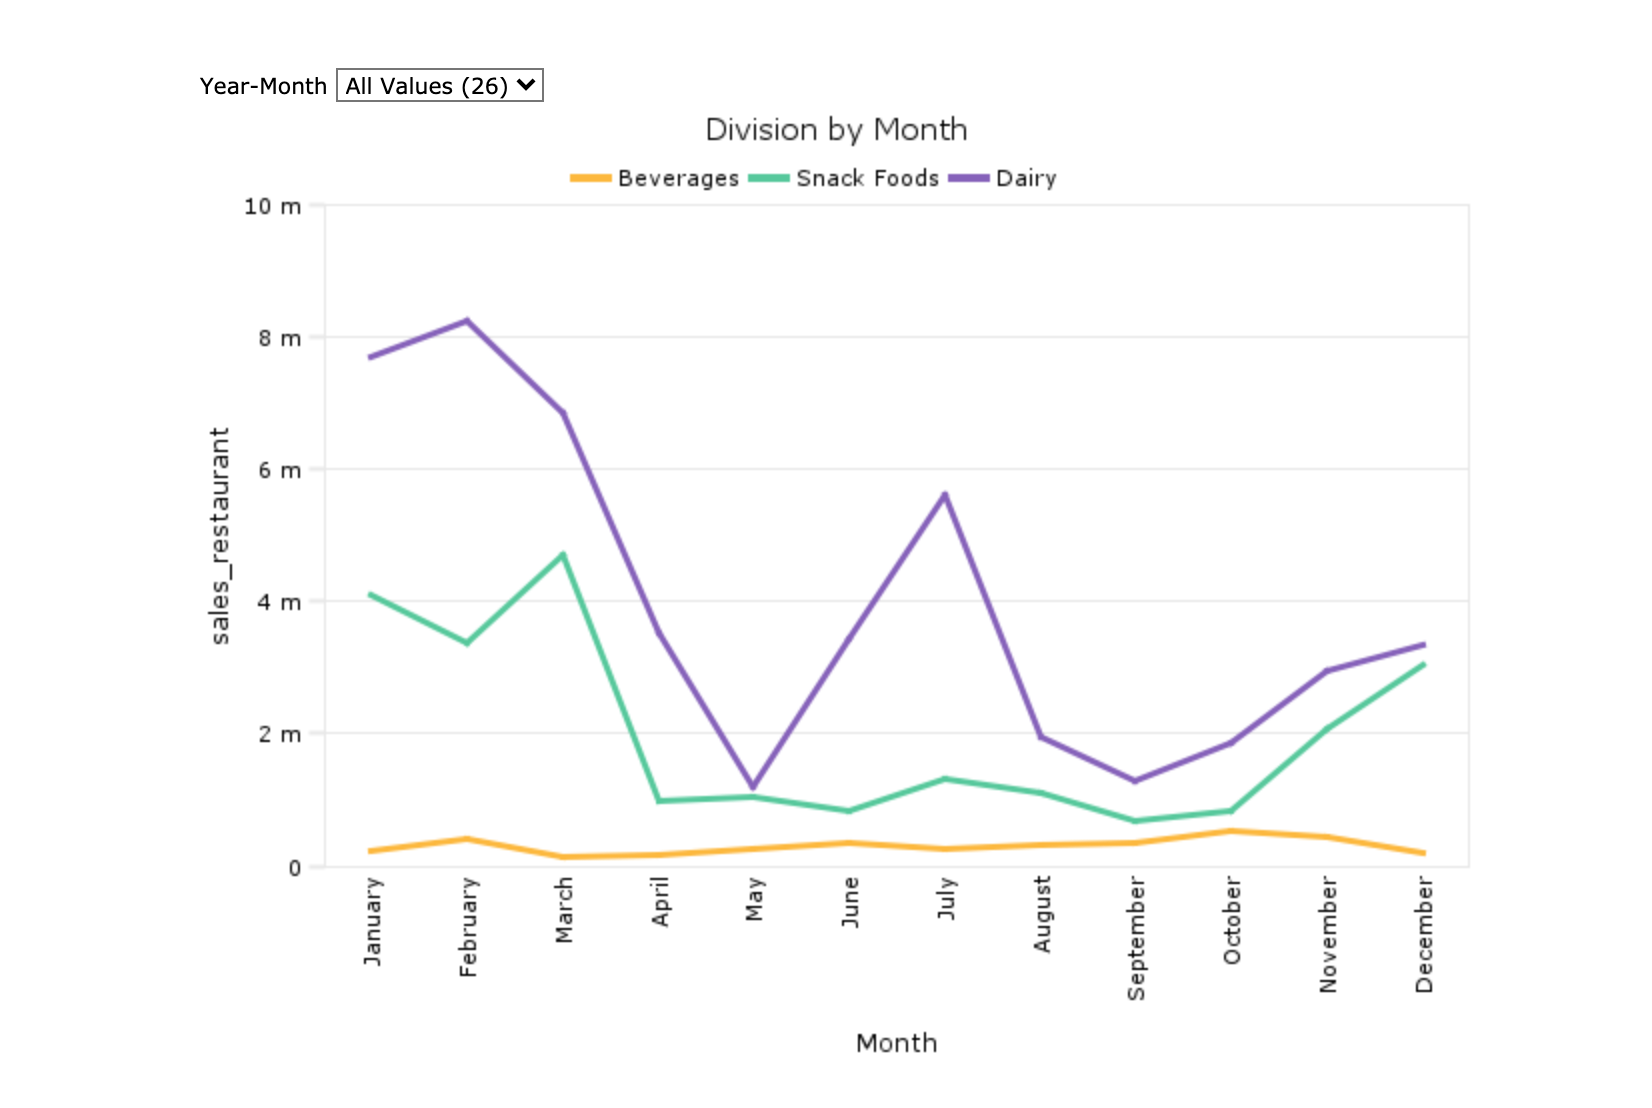
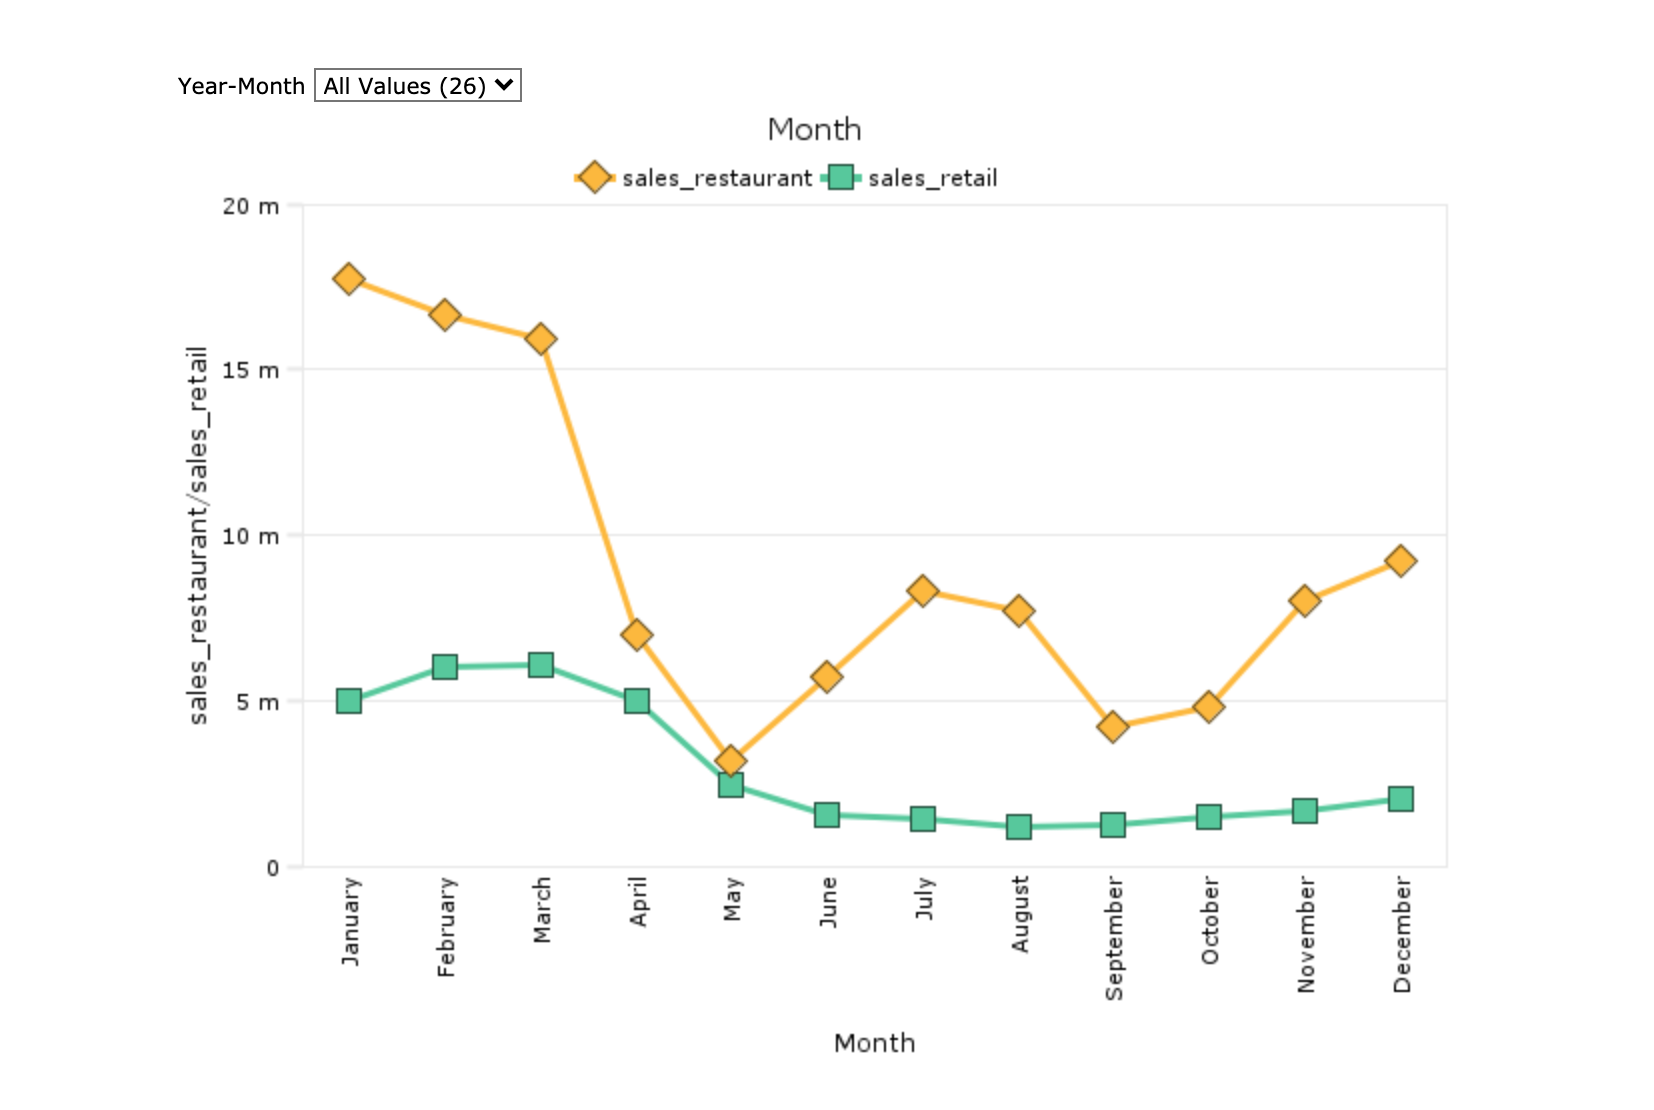
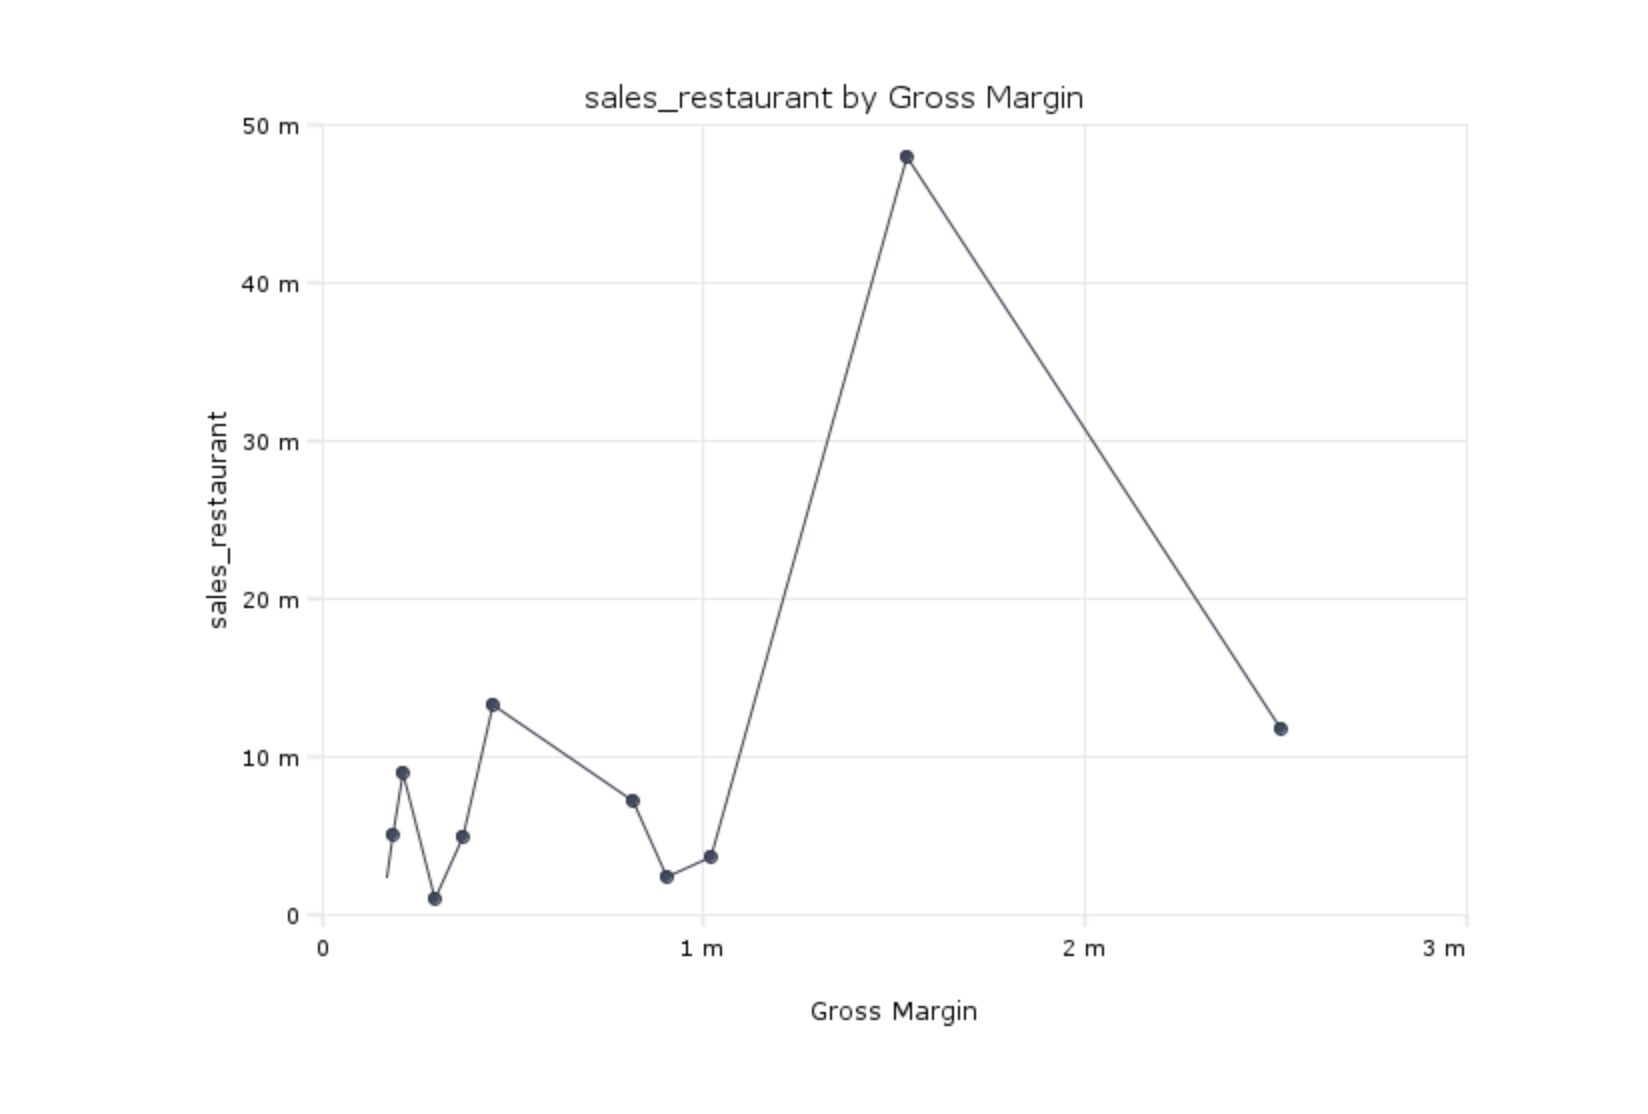
Line Plot Graph
A line plot graph draws straight lines between data points.
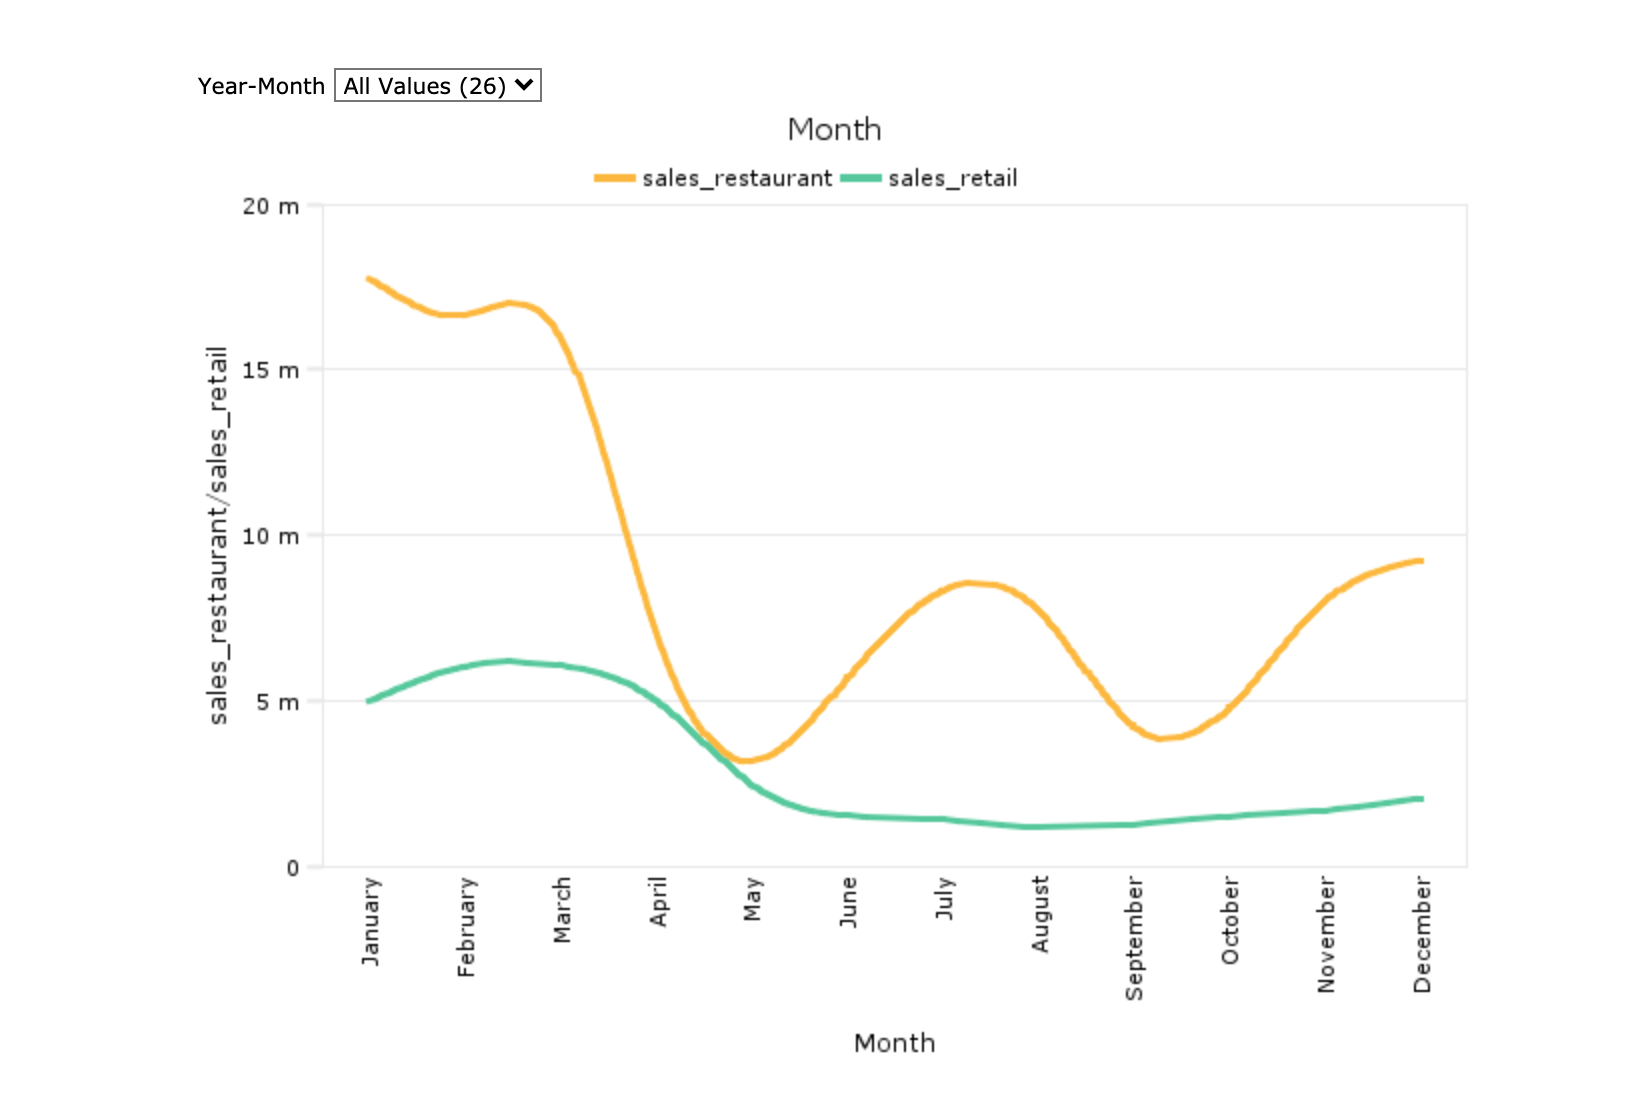
Spline Plot Graph
A spline plot graph draws curved lines between data points.
3-D Line Plot Graph
A spline plot graph draws 3-D curved lines between data points.
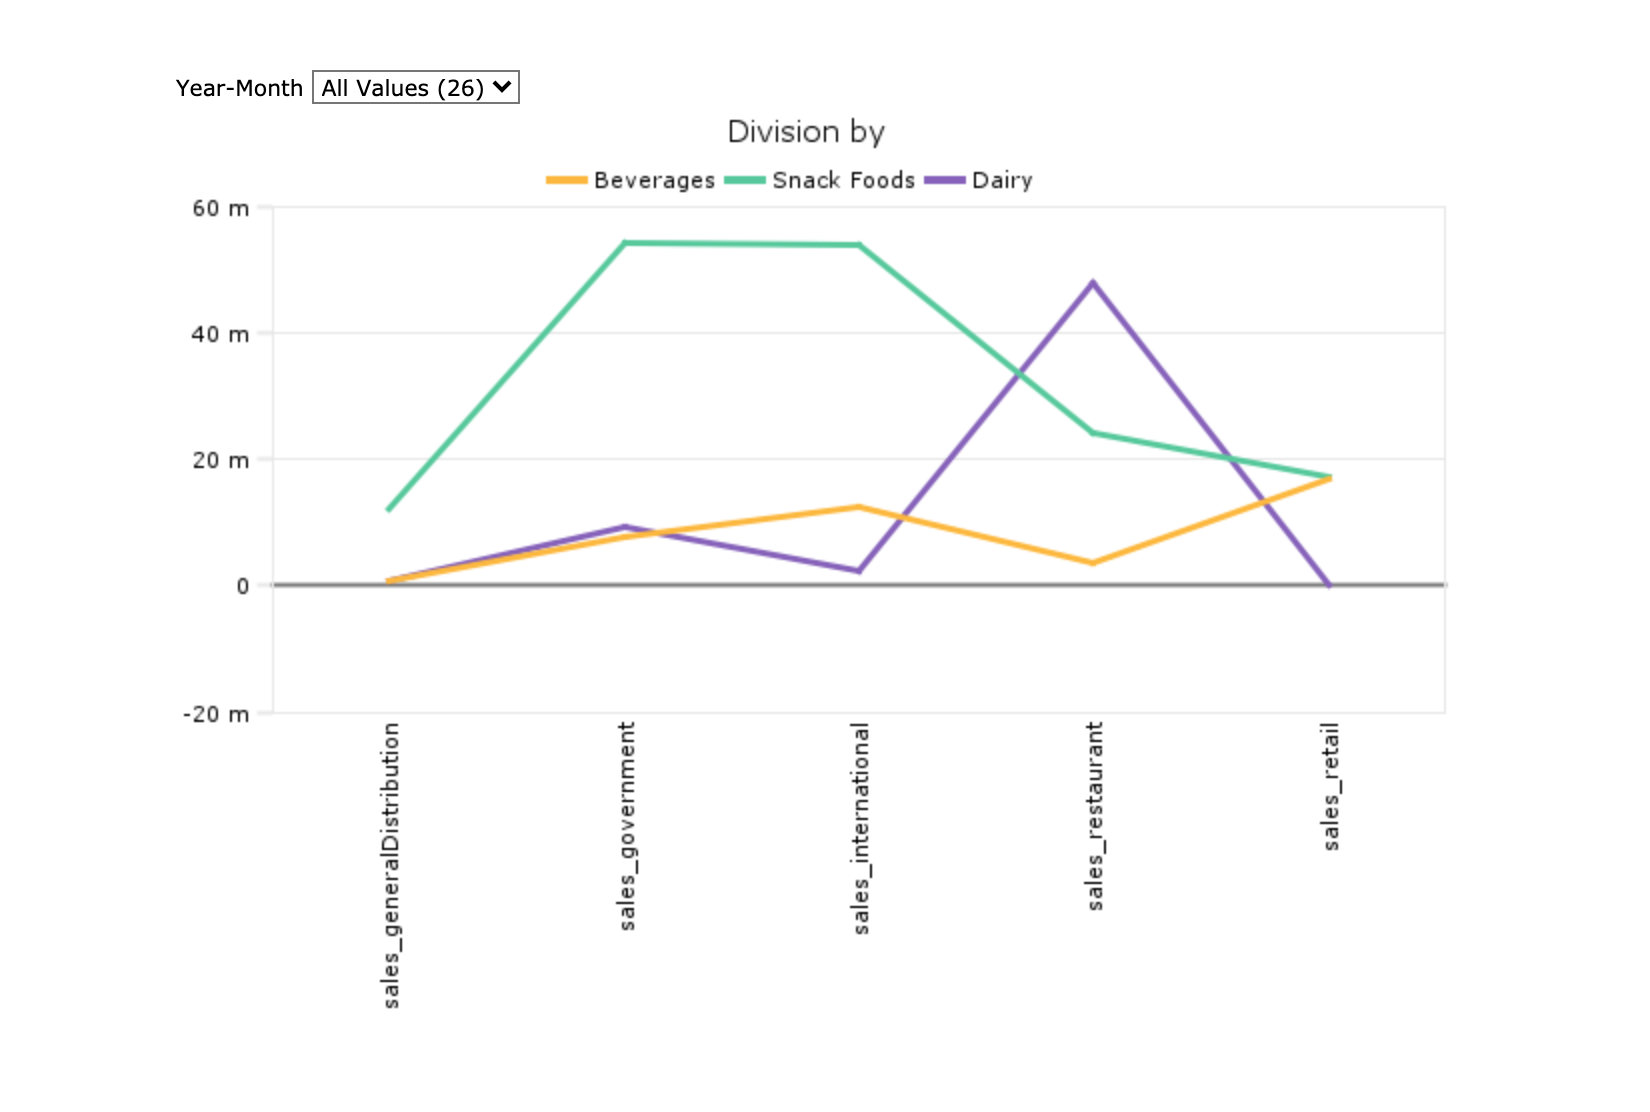
Line Cross Plot
Cross plot graphs shows data that pertains to two dimensions simultaneously.
Line Summary Cross Plot
Cross plot graphs shows data that pertains to two dimensions simultaneously.
3-D Line Cross Plot
Cross plot graphs shows data that pertains to two dimensions simultaneously.
3-D Line Summary Cross Plot
Cross plot graphs shows data that pertains to two dimensions simultaneously.
Pies (4)

ProDiver
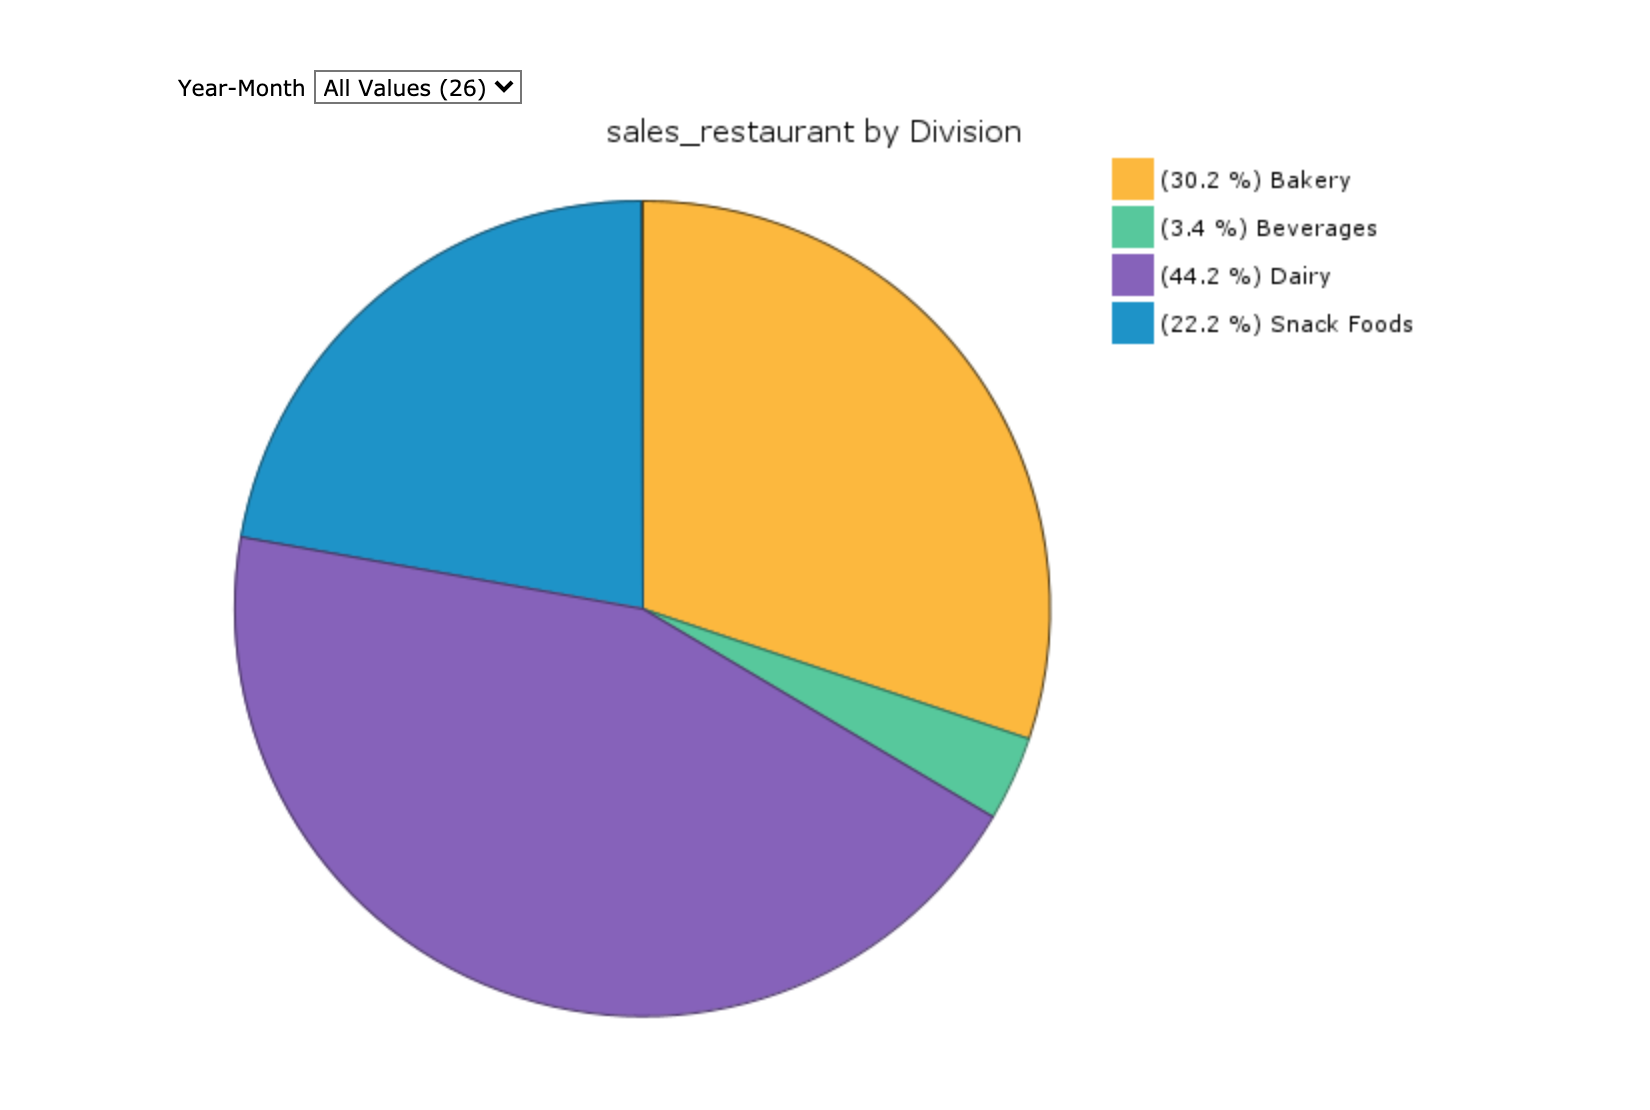
Pie Plot Graph
Pie plot graphs display up to 16 values for a single dimension. If there are more than 16 values, the graph displays the first 15 values listed in the tabular display, and combines the remaining values in a 16th wedge called Other.
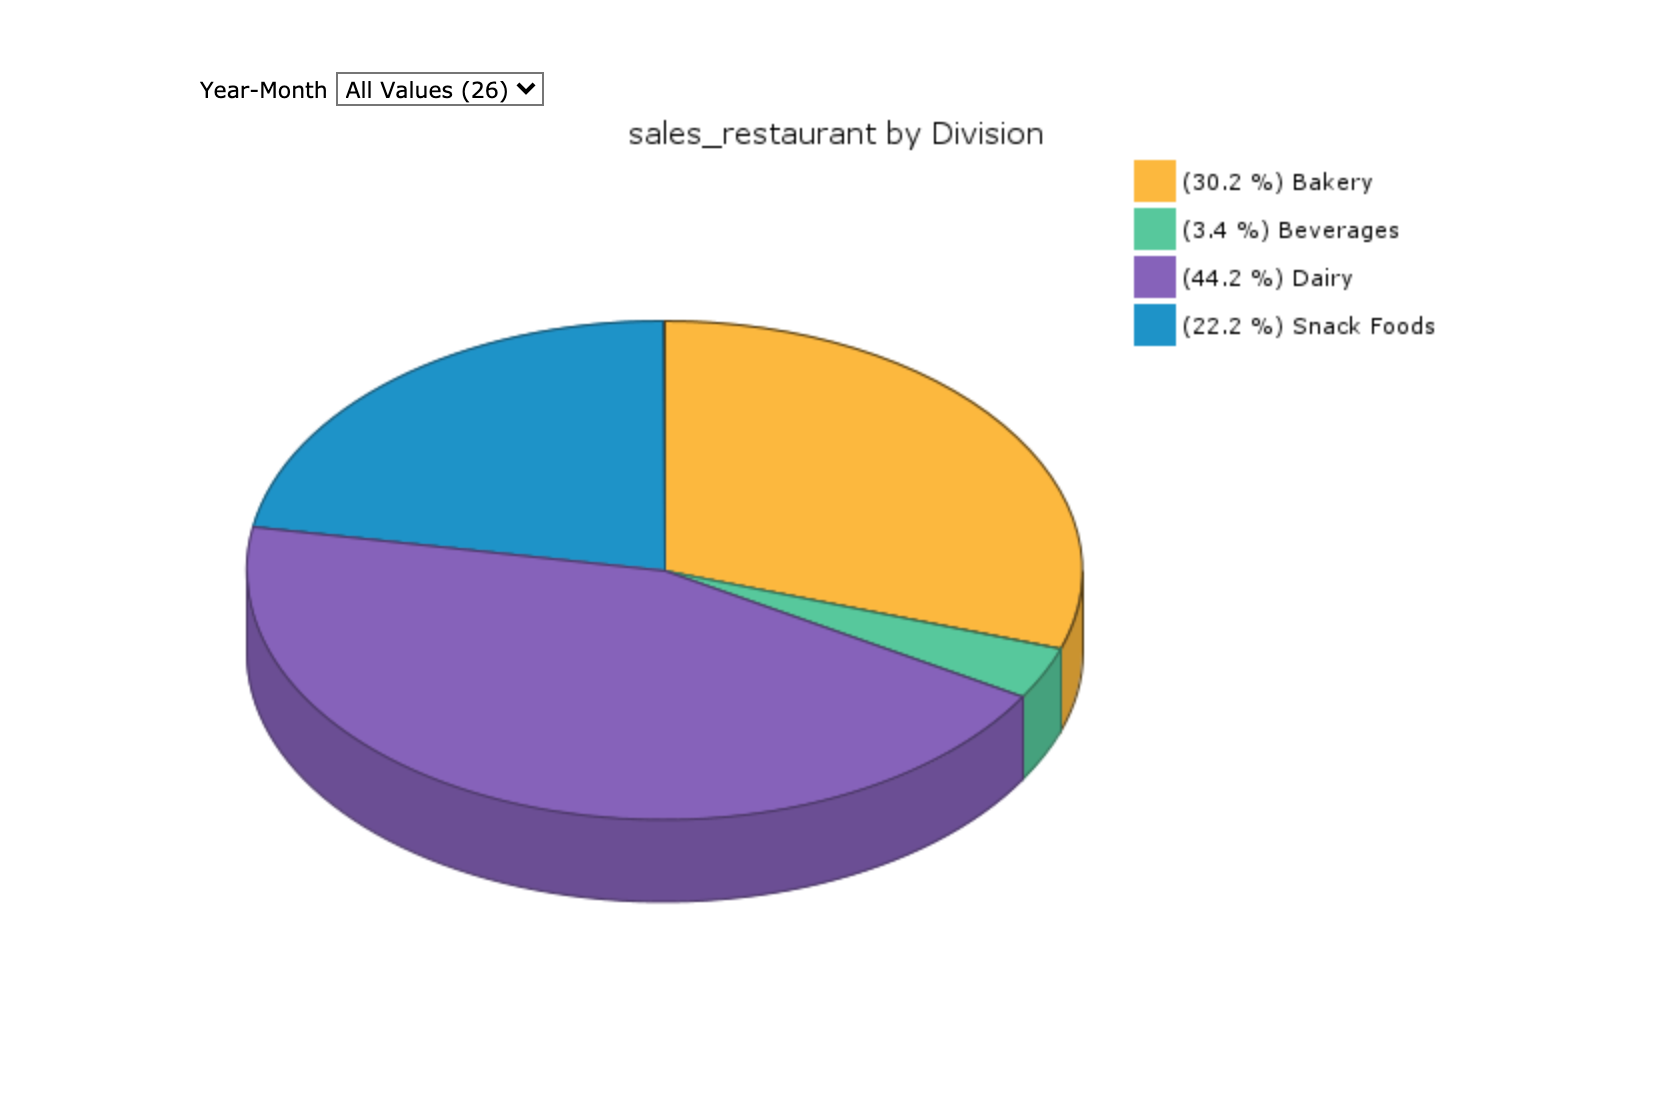
3-D Pie Plot Graph
Pie plot graphs display up to 16 values for a single dimension. If there are more than 16 values, the graph displays the first 15 values listed in the tabular display, and combines the remaining values in a 16th wedge called Other.
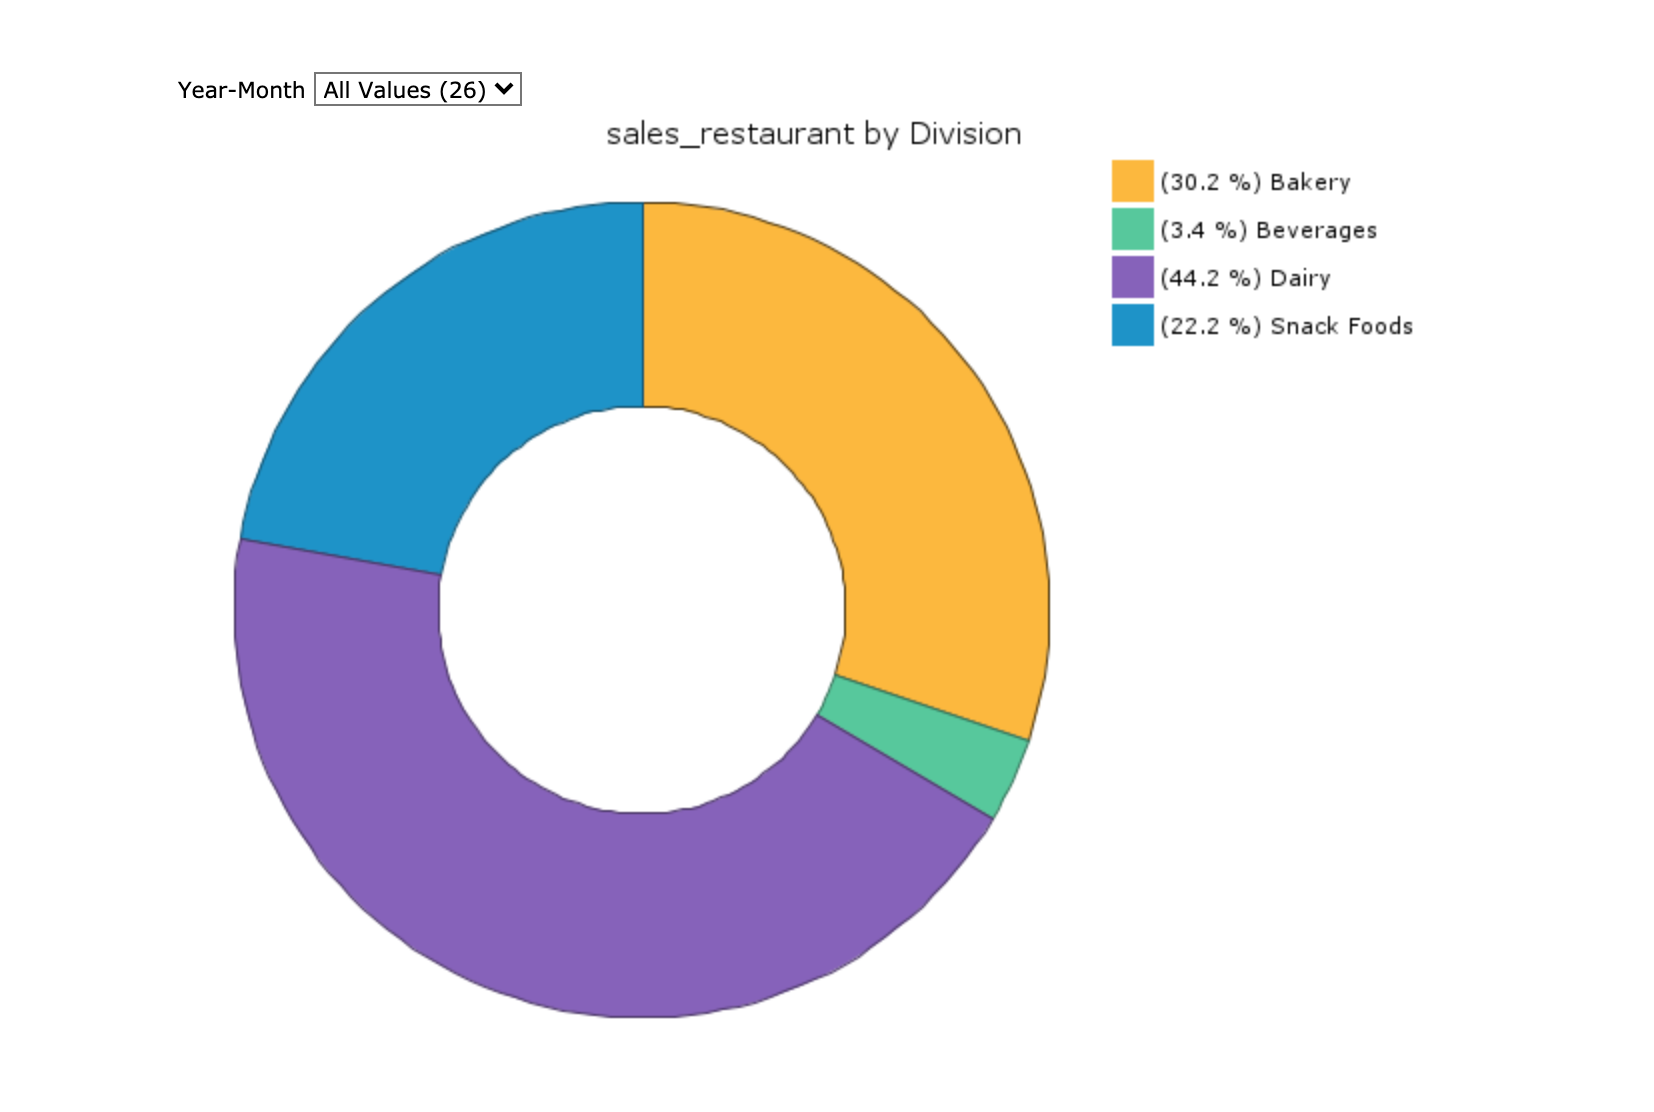
Doughnut Plot Graph
Doughnut plot graphs display up to 16 values for a single dimension. If there are more than 16 values, the graph displays the first 15 values listed in the tabular display, and combines the remaining values in a 16th wedge called Other.
3-D Doughnut Plot Graph
Doughnut plot graphs display up to 16 values for a single dimension. If there are more than 16 values, the graph displays the first 15 values listed in the tabular display, and combines the remaining values in a 16th wedge called Other.
Points (3)

ProDiver
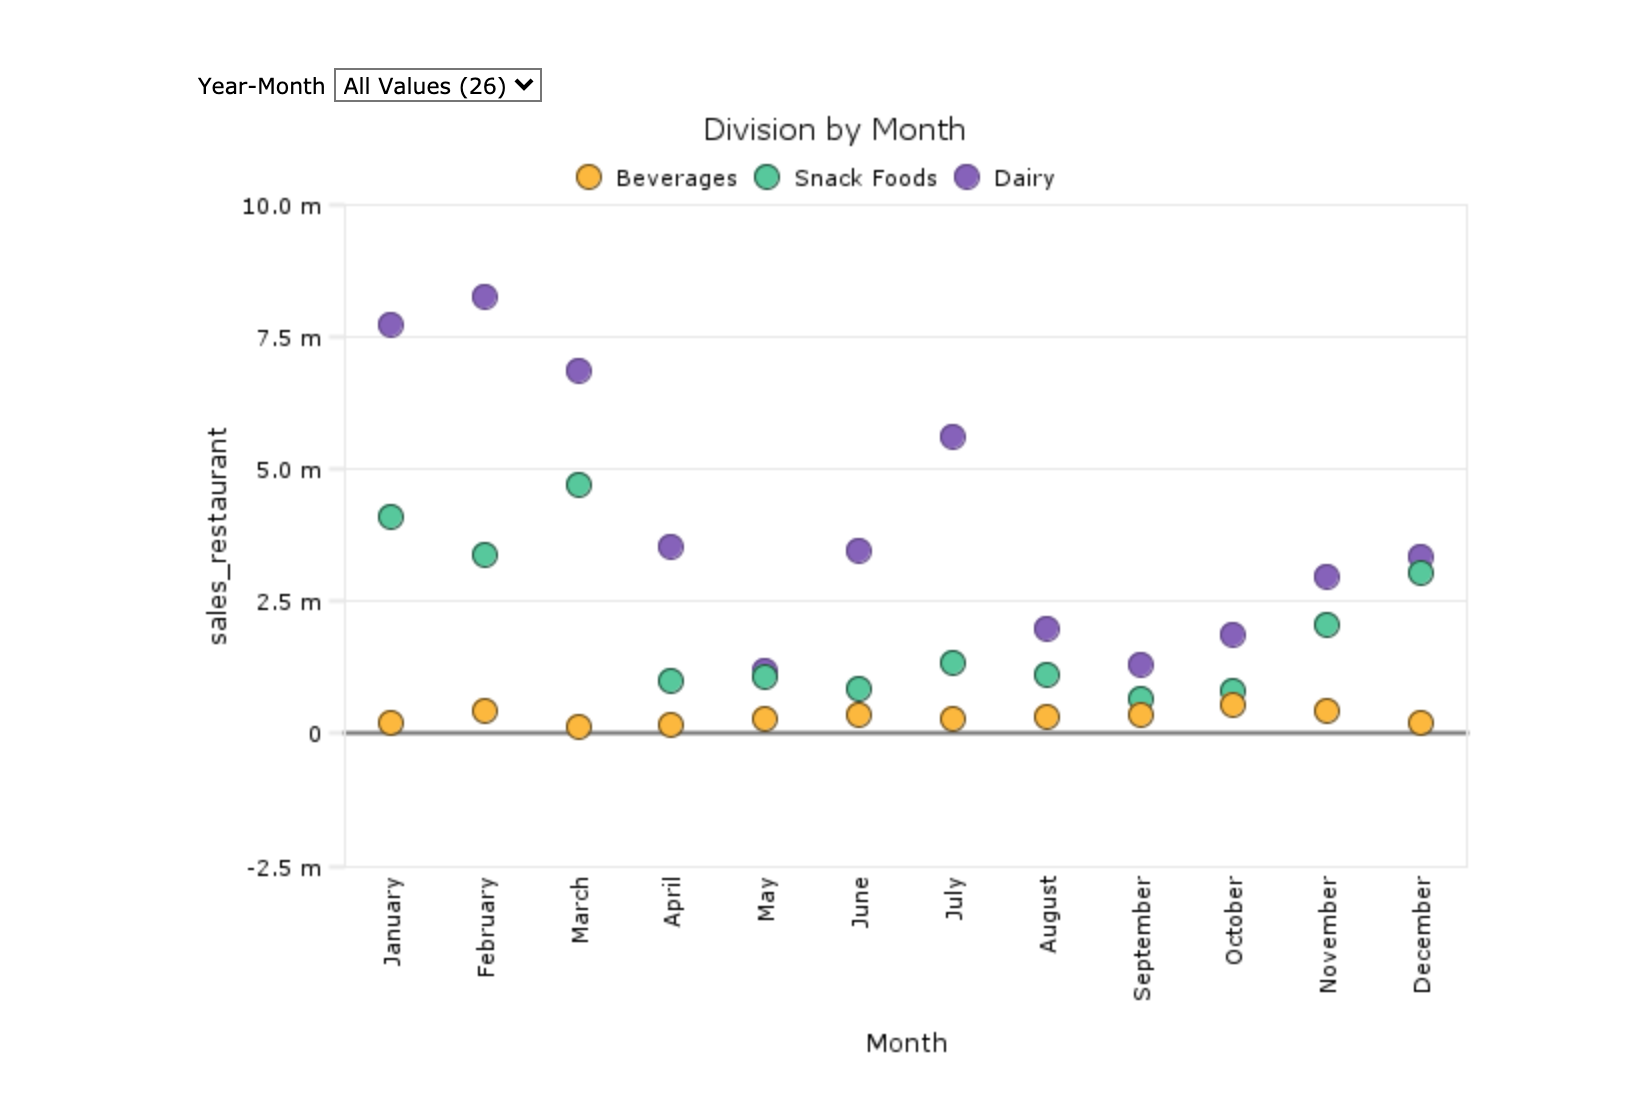
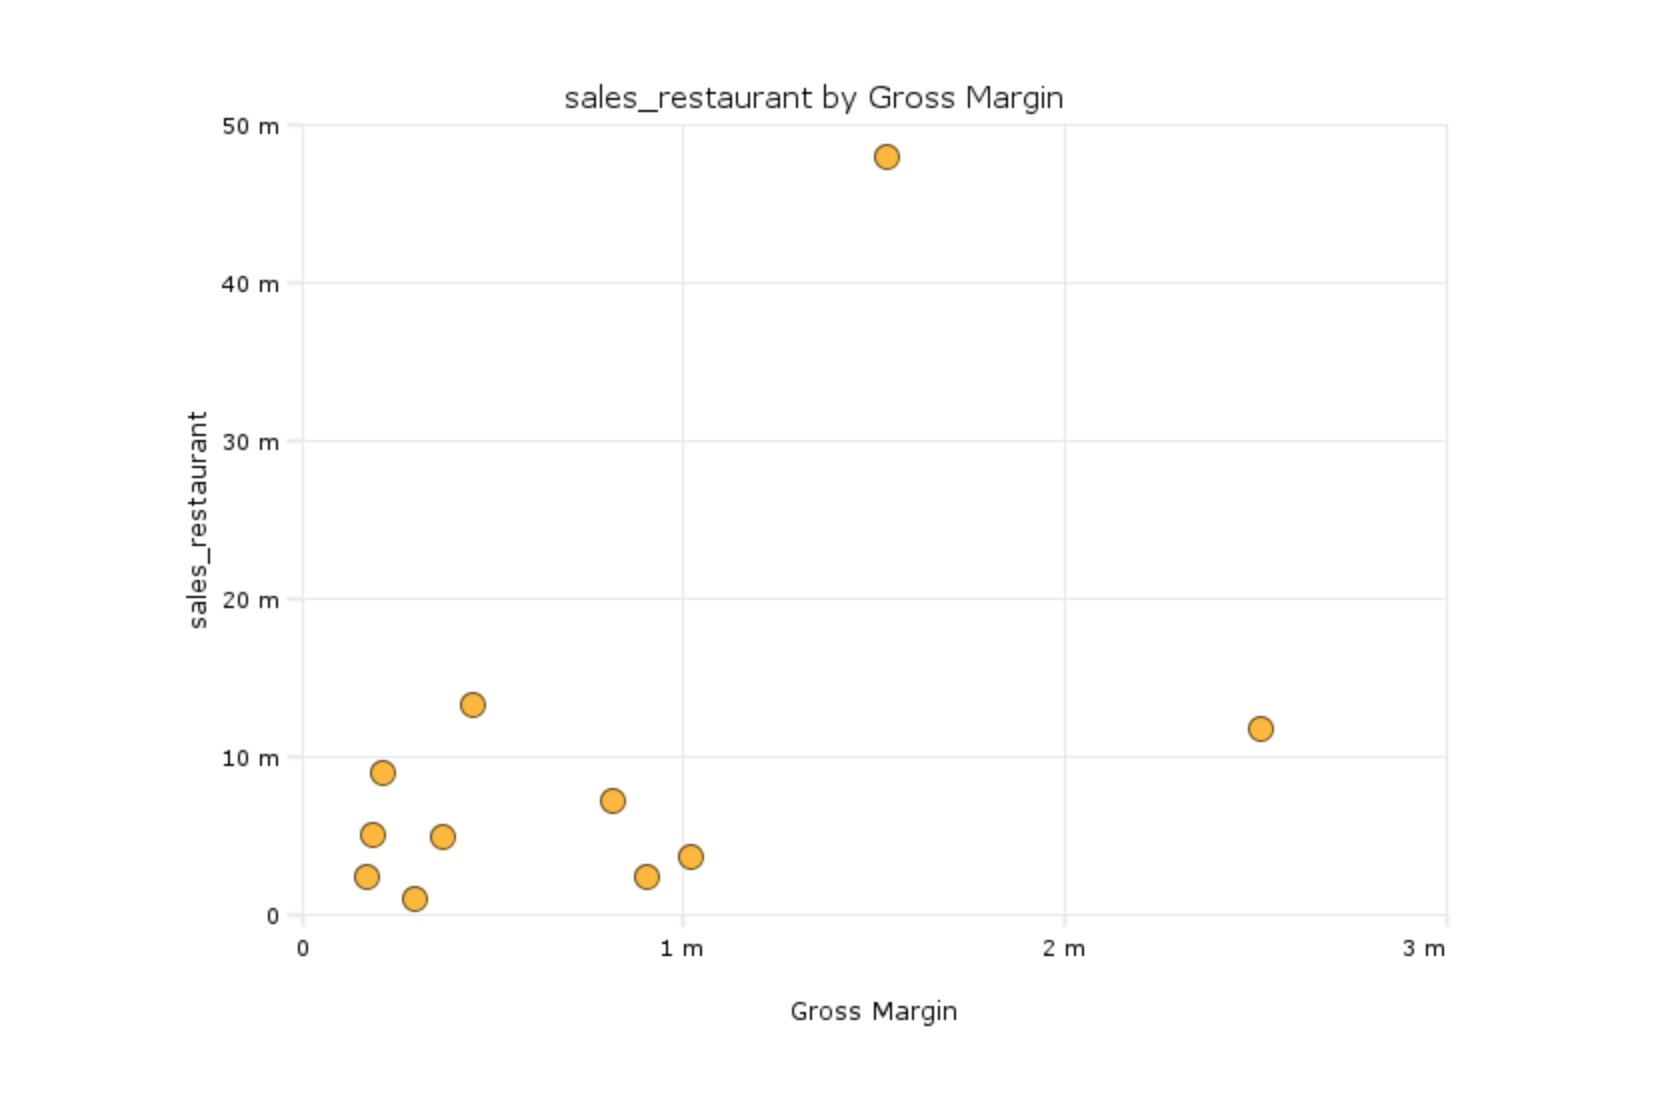
Point Plot Graph
Basic plot graphs display data for a single dimension and up to 16 summaries. They consist of a series of plotted points that correspond to summary values being displayed.
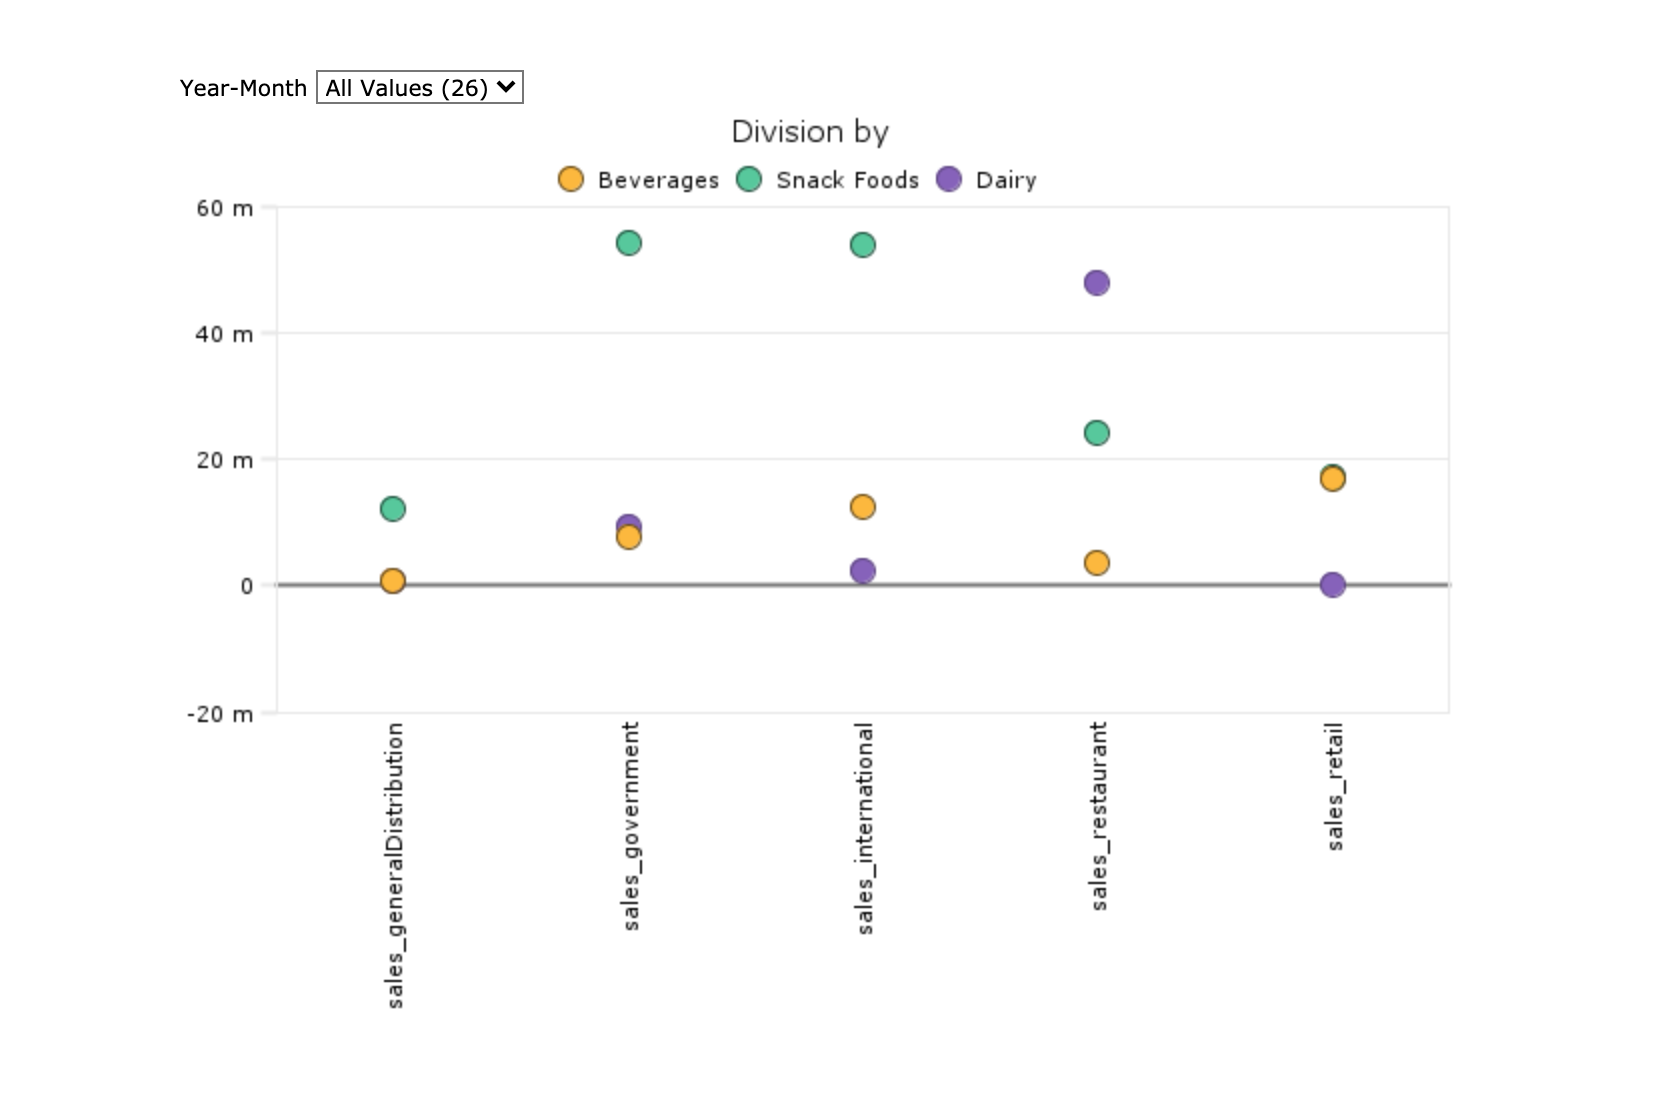
Point Cross Plot
Cross plot graphs shows data that pertains to two dimensions simultaneously.
Point Summary Cross Plot
Cross plot graphs shows data that pertains to two dimensions simultaneously.
Radar (3)
ProDiver
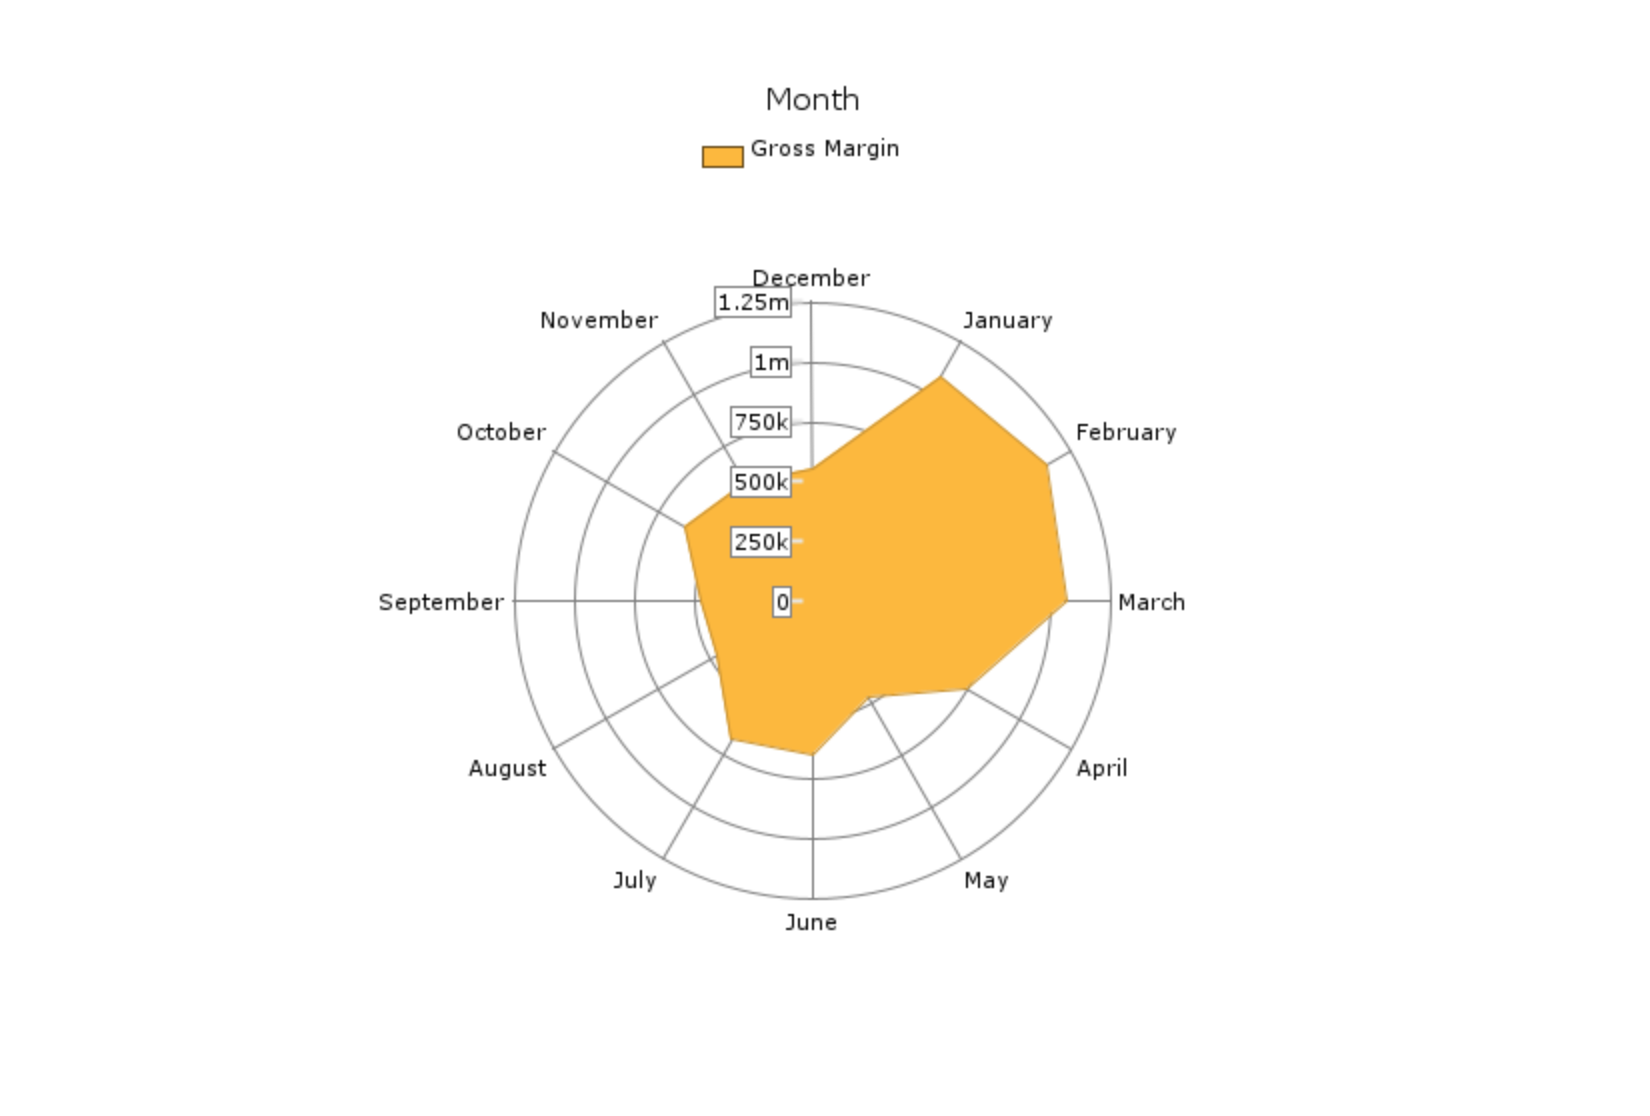
Radar Area Graph
Radar graphs display summary values as radius points from a common central axis.
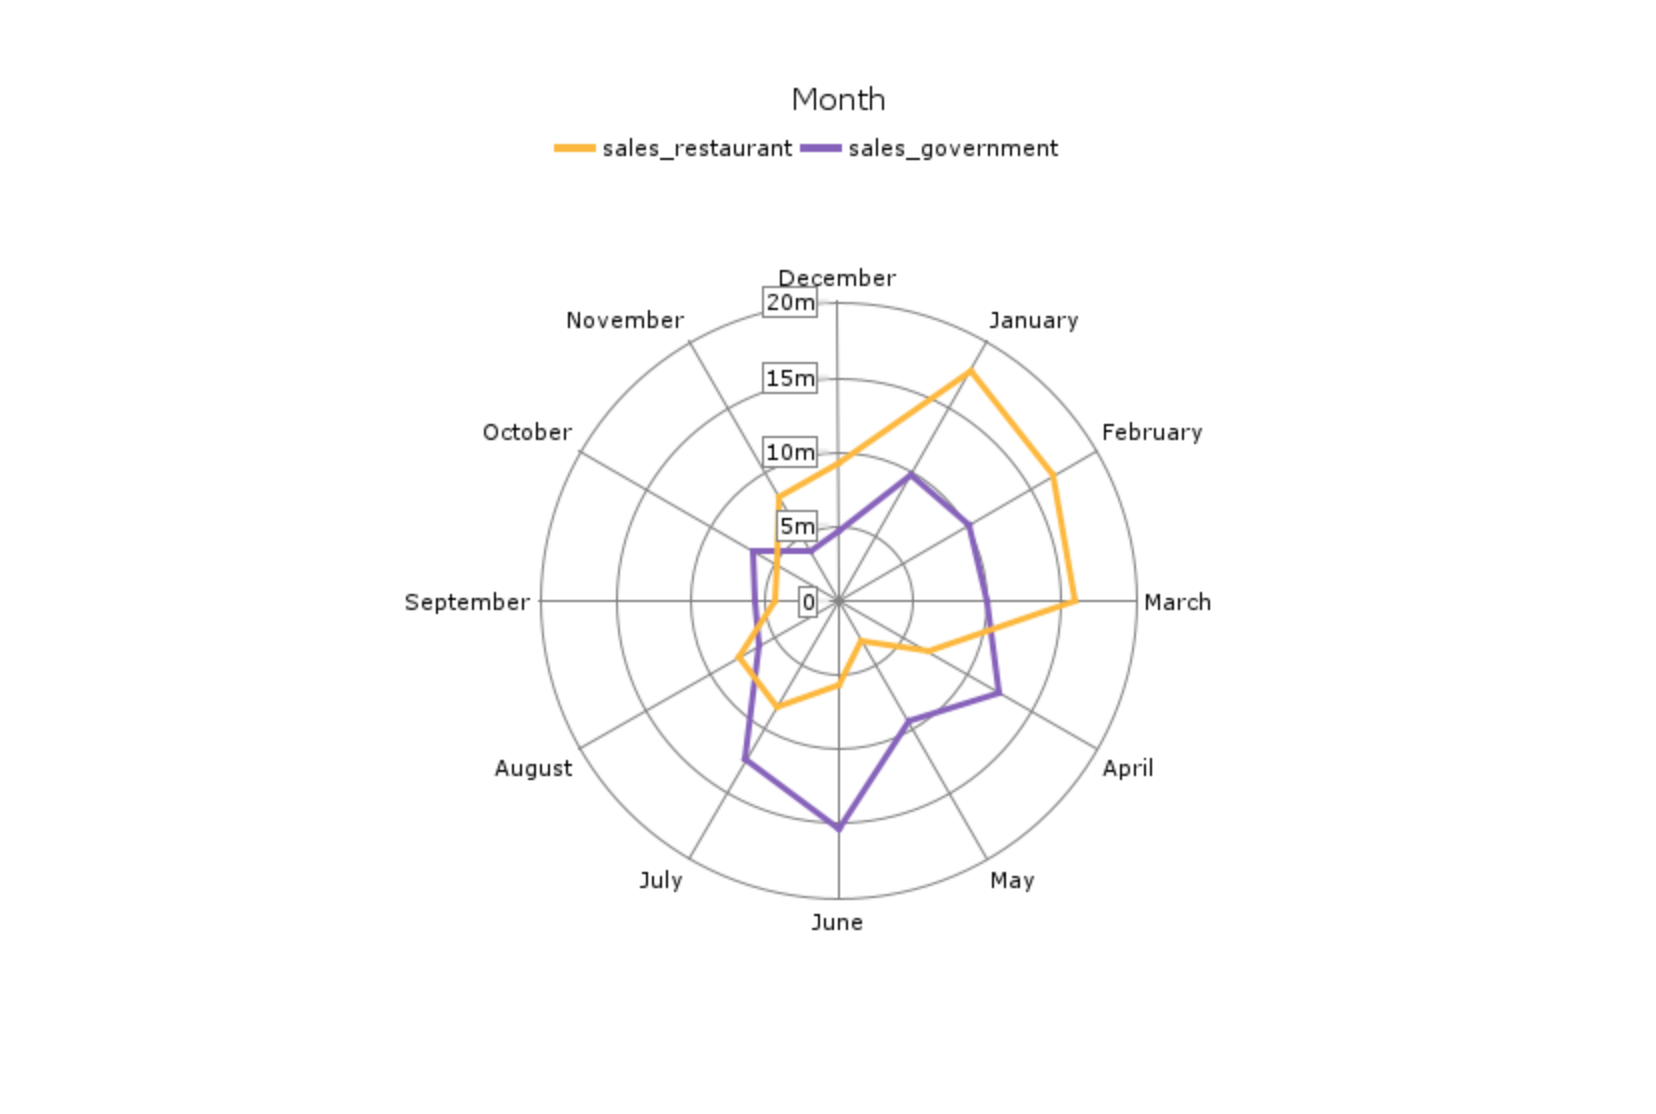
Radar Line Graph
Radar graphs display summary values as radius points from a common central axis.
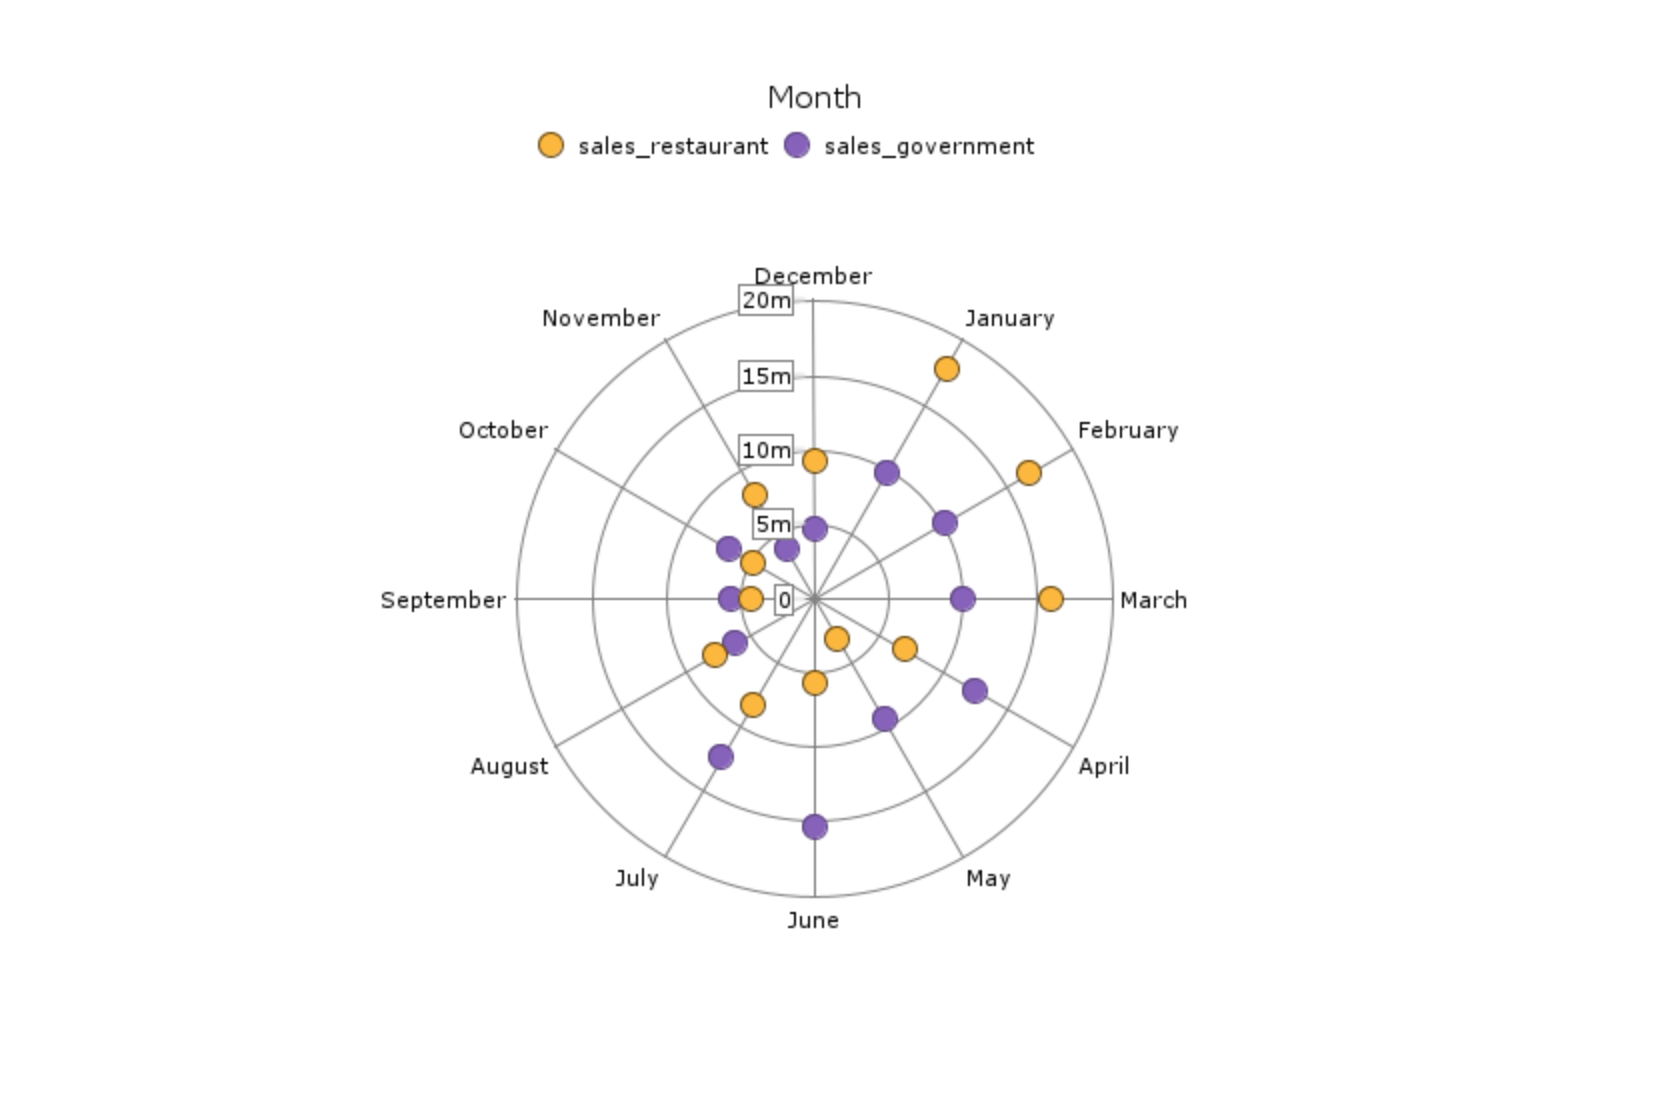
Radar Point Graph
Radar graphs display summary values as radius points from a common central axis.
Scatter (3)
ProDiver
Scatter (Bubble)
Scatter graphs display data for two summaries across a single dimension.
Scatter (Line)
Scatter graphs display data for two summaries across a single dimension.
Scatter (Point)
Scatter graphs display data for two summaries across a single dimension.
Spider (1)
ProDiver
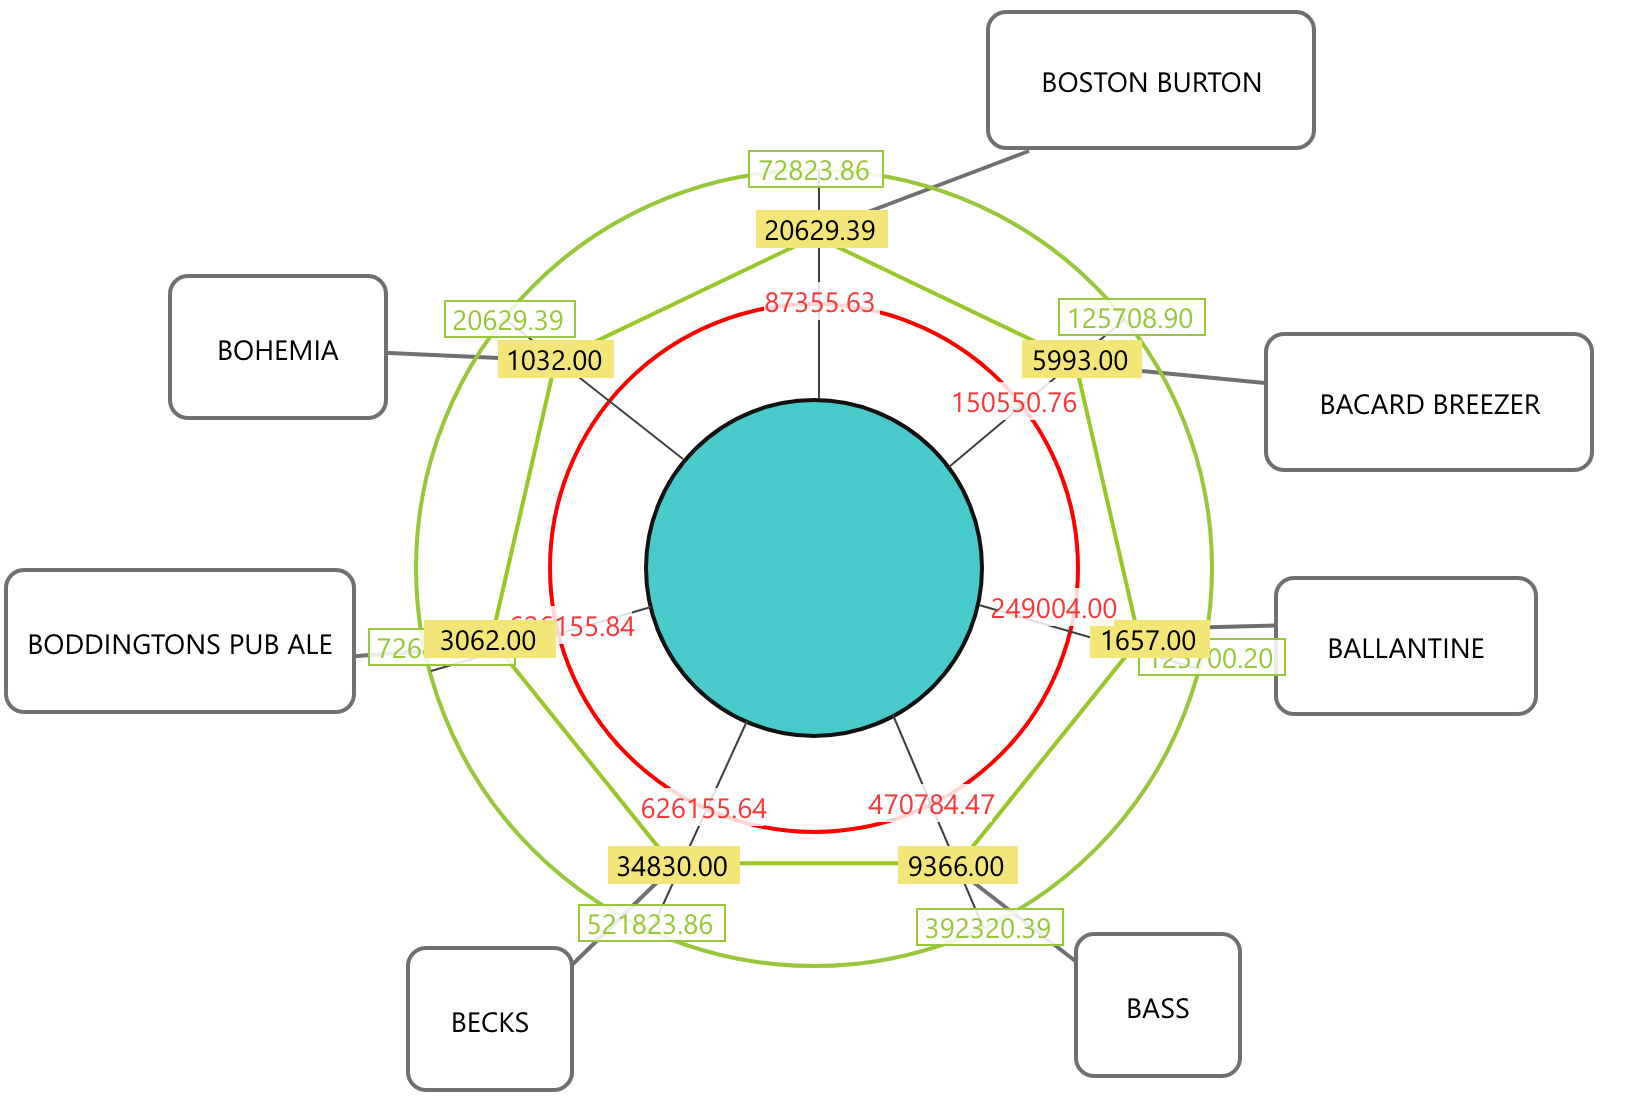
Spider Graph
A Closed spider graph is a chart that consists of a sequence of evenly-spaced spokes, with each spoke representing a variable (row). They can be used to display unrelated data because the data points are relative to the column threshold and goal values as opposed to each other. A line is drawn connecting the data values for each spoke. This gives the plot a spider web-like appearance.
Time (1)
ProDiver
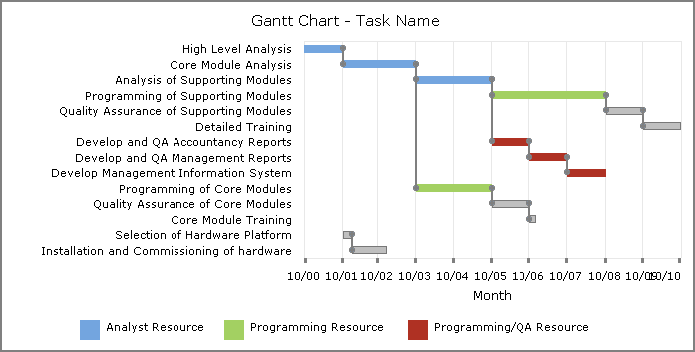
Gantt Chart
Time Graphs show linear bars that represent a range of time.